An Amazon Web Services (AWS) data warehouse provides the cloud foundation to solve this. It’s a central repository for all your structured data, ready for analysis. Business Intelligence (BI) tools then connect to this governed data, transforming it into the reports, dashboards, and insights that drive strategy. This guide explores how Indian enterprises can build a powerful analytics environment on AWS.
We'll cover the core architecture, service selection, key business use cases for finance and compliance, implementation stages, governance controls, and cost considerations.
Key Takeaways
- A successful AWS BI platform is an ecosystem of services for ingestion, storage, transformation, governance, and visualisation, not just a single tool.
- Service selection must align with specific needs like reporting latency, data volume, security requirements, and user skills.
- Finance and compliance teams require consistent metric definitions, traceable data lineage, and role-based access for audit-ready reporting.
- The best approach is to start with a focused business use case, establish strong data quality controls, and scale the platform in phases.
AWS Data Warehouse and Business Intelligence: The Fundamentals
An AWS data warehouse is a centralised, structured repository that consolidates data from disparate sources. This includes information from your ERP, CRM, finance platforms, transaction systems, and other applications, making it available for analysis.
The term "data warehouse" is often used alongside related concepts. Clear distinctions help you choose the right architecture.
Data Lake vs. Data Warehouse vs. Lakehouse
| Component | Description | Best For |
|---|---|---|
| Data Lake | A central repository that stores vast amounts of structured and unstructured data in its raw, native format. | Storing all data "as-is" for future, undefined analysis; ideal for data scientists and advanced analytics. |
| Data Warehouse | An organised repository that stores cleansed, structured, and modelled data specifically for BI and reporting. | Powering executive dashboards, financial reporting, and operational analytics where speed and consistency are key. |
| Lakehouse | A modern architecture that combines the flexibility of a data lake with the data management features of a warehouse. | Unifying diverse data types while enabling direct BI queries and machine learning workloads on the same repository. |
| BI Layer | The visualisation and reporting tools that sit on top of the data warehouse or lakehouse, used by business users. | Creating interactive dashboards, generating reports, and performing ad-hoc analysis to answer business questions. |
The End-to-End Data Flow
The journey from raw data to executive insight follows a clear path:
- Source Systems: Data originates in systems like your ERP, CRM, or tax compliance software.
- Ingestion: Data is extracted and moved into the AWS cloud, typically into a data lake.
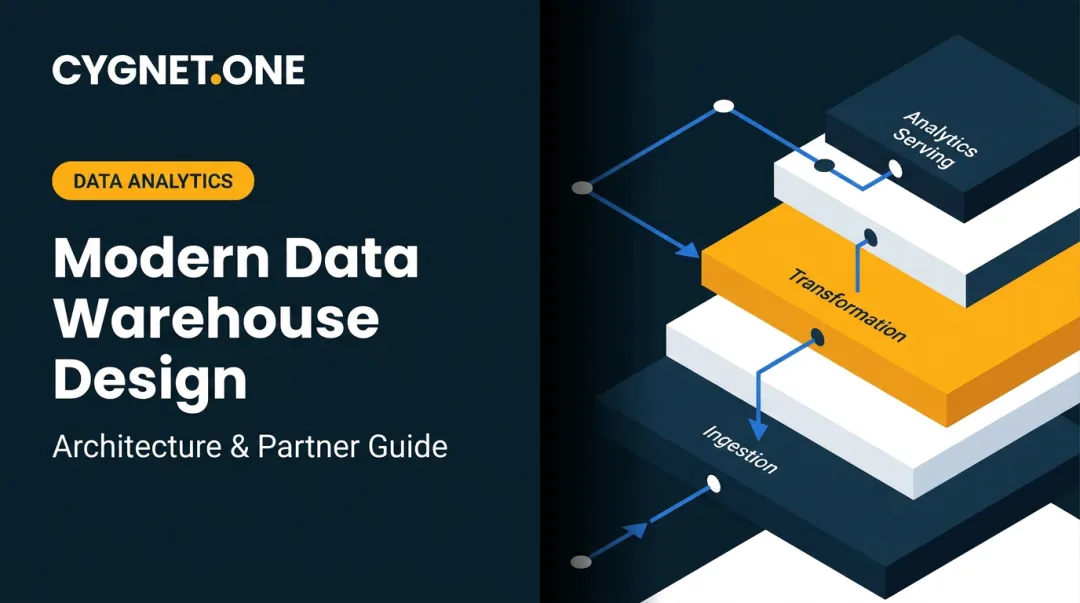
- Storage & Transformation: Raw data is stored, then cleansed, standardised, and transformed into a structured format.
- Curated Data Models: The transformed data is organised into a data warehouse with clear business definitions and relationships (facts and dimensions).
- Analytics & BI: Business users access this curated data via BI tools to create dashboards, run ad-hoc queries, and generate reports.
Operational Reporting vs. Business Intelligence
Different types of reporting serve different purposes:
- Operational Reporting: Focuses on day-to-day activities. For example, a daily invoice reconciliation report that flags mismatches.
- Analytical Reporting: Looks at trends over time. For example, a monthly CFO report that analyses revenue, costs, and profitability against budget.
- Business Intelligence (BI): Goes beyond reporting to ask why things are happening. For example, an interactive dashboard that allows an analyst to drill down into sales data to understand which products are driving regional growth.
Key stakeholders have different needs. Executives want trusted summaries, finance teams demand reconciled figures, analysts need flexibility for exploration, and IT requires a secure, maintainable architecture. A well-designed AWS platform serves them all from a single source of truth.

AWS Architecture and Service Selection
Building a data platform on AWS involves choosing the right services for each stage of the data lifecycle. While every architecture is unique, the core components and their roles are consistent.
Here are the principal AWS services and their functions in a BI environment:
| Service | Role in the BI Architecture |
|---|---|
| Amazon S3 | The foundational data lake. Its durability and low cost make it the ideal place to store raw data from all sources. |
| AWS Glue | A serverless data integration service. It discovers your data, builds a central Data Catalog, and runs ETL (Extract, Transform, Load) jobs to clean and prepare data. |
| Amazon Redshift | The high-performance data warehouse. It's optimised for complex analytical queries on large, structured datasets, making it perfect for powering BI dashboards. |
| Amazon Athena | A serverless query engine that lets you run standard SQL queries directly on data stored in Amazon S3. It's great for ad-hoc analysis without loading data into a warehouse. |
| Amazon QuickSight | The native AWS business intelligence service. It connects to your data sources to create and share interactive dashboards and visual analytics. |
For near-real-time needs, Amazon Kinesis or Amazon Data Firehose ingest and process streaming data. That path adds complexity and cost, so choose it only when decisions truly depend on sub-minute latency.
Semantic Data Model
The bridge between your data warehouse and business users is a dimensional or semantic data model. This model organises your data into:
- Facts: Numbers or metrics you measure, such as sales amount or invoice count
- Dimensions: Context for those numbers, such as customer, product, date, or location
- Business definitions: Agreed meanings for every metric, such as what counts as an "active customer"
- Calculated measures: Reusable calculations such as year-over-year growth or profit margin
This model ensures everyone in the organisation speaks the same data language, eliminating confusion and building trust in the numbers.
Illustrative Architecture Example
Below is a simplified, illustrative architecture. Your specific design will depend on your unique requirements.
(Illustrative Diagram Description)
- Sources: ERP, CRM, and finance systems feed the next layer
- Ingestion and storage (data lake): AWS Glue crawler and Amazon S3 hold raw and processed data
- Transformation and cataloguing: Glue ETL jobs prepare S3 data and update the Glue Data Catalog
- Warehouse and query layer: Curated data lands in Amazon Redshift; Athena can query data in place on S3
- BI and visualisation: Redshift and Athena feed Amazon QuickSight dashboards
- Governance and security: IAM, KMS encryption, and CloudTrail logging wrap the stack
This diagram shows how services work together to create a cohesive data flow from source to insight.

Business Use Cases and Value
An AWS BI platform delivers value across the entire organisation, especially for Indian enterprises navigating complex financial and regulatory landscapes.
Finance and CFO Dashboards
The office of the CFO can move from manual spreadsheet consolidation to automated, real-time dashboards. By integrating data from accounting software, ERPs, and banking systems, leaders gain a unified view of:
- Revenue, expenses, and profitability
- Cash flow and working capital
- Accounts receivable and payables ageing
- Budget vs. actuals analysis
- Key performance indicators (KPIs)
This single source of truth enables faster period-end closing, more accurate forecasting, and strategic decision-making based on trusted data.
Tax, Invoice, and GST Compliance
For Indian businesses, managing GST and e-invoicing is a major operational challenge. An analytics platform can provide critical visibility:
- Reconciliation: Automatically reconcile GSTR-2B data with purchase records to maximise ITC claims and meet Section 16 CGST Act conditions.
- E-invoicing Monitoring: Track compliance with the e-invoicing mandate, which applies to businesses with turnover above ₹5 crore under Notification 10/2023-Central Tax.
- Exception Alerts: Flag transactions that fail validation or approach reporting deadlines, such as the 30-day window for taxpayers with AATO above ₹10 crore.
- Audit Support: Provide auditors with a clear, traceable data trail for all tax-related transactions.
Governed Analytics for BFSI
Banking, NBFC, and insurance firms in India operate under strict regulatory oversight from bodies like the RBI. A governed AWS analytics platform helps them:
- Monitor loan portfolios for risk concentration and performance.
- Segment customers for targeted marketing and cross-selling.
- Analyse turnaround times for processes like loan origination or claims processing.
- Generate data for regulatory reporting with full data lineage.
Real-world examples show the impact. A case study of Axis Bank's 2024 implementation notes that with Amazon Redshift and QuickSight, reporting and data availability time was reduced from 6 hours to just a few minutes.

BI for Manufacturing, FMCG, and IT Services
Beyond finance, BI drives efficiency across various sectors:
- FMCG & Manufacturing: Analyse sales performance by region, track supplier delivery times, and optimise inventory levels.
- IT Services & BPO: Monitor project profitability, track workforce utilisation, and measure service delivery against SLAs.
- MSMEs: Gain visibility into collections, manage cash flow, and identify growth opportunities without a large IT team.
Organisations connecting transactional systems to governed analytics benefit from partners who understand both the technology and the compliance context. Cygnet.One, with experience across GST compliance, e-invoicing, and ERP integrations, helps businesses structure their AWS data foundation for accurate, audit-ready reporting.
Implementation Roadmap for an AWS BI Environment
A successful BI implementation works best as a phased programme. A structured roadmap helps you deliver value quickly and build a scalable platform for the future.
Start with Business Discovery Before writing any code, document the business needs. Identify priority decisions that need better data, current reporting pain points, and key dashboard users. Define success criteria, such as reducing report generation time or improving forecast accuracy.
Audit and Prioritise Data Sources Map out all potential data sources. Evaluate them based on reliability, business value, and ease of integration. Identify and flag issues like duplicate records, inconsistent formats, or conflicting data that need to be resolved during transformation.
Design a Minimum Viable Product (MVP) Keep the first release tightly scoped. Start with one high-impact use case, such as a finance dashboard or a sales reconciliation workflow. Define the target data model, source-to-target mappings, validation rules, and the final reporting outputs for this specific MVP.
Build and Test Incrementally Develop the platform in layers: ingestion, storage, transformation, and visualisation. Implement automated testing at each stage to check for issues like schema changes, failed data loads, or reconciliation differences. The AWS Analytics Lens recommends implementing data quality checks early in the process to prevent bad data from propagating downstream.
Establish an Operating Model A data platform needs clear ownership. Define roles and responsibilities for data stewardship, dashboard certification, and release management. Create documentation, provide user training, and establish a process for handling incidents and continuous optimisation.

Governance, Security, Cost, and Partner Selection
For a BI platform to be trusted, especially in regulated industries, it must be secure, well-governed, and cost-effective.
Security and Governance Fundamentals
A robust governance framework is non-negotiable for finance and compliance workloads.
- Security Controls: Implement foundational security measures, including least-privilege IAM roles, encryption of data at rest and in transit, network isolation using VPCs, and comprehensive logging with AWS CloudTrail.
- Data Governance: Establish clear data lineage to track data from its source to the final report. Assign ownership for key metrics, document reconciliation evidence for auditors, and enforce data retention policies.
- Access Management: Use role-based access controls within the BI tool to ensure users only see the data they are authorized to view. Mask sensitive PII data where necessary.
Understanding AWS Cost Drivers
AWS costs are variable and depend on usage. Key cost drivers include:
- Storage: The volume of data stored in Amazon S3.
- Data Processing: The compute resources used by AWS Glue for ETL jobs.
- Warehouse Capacity: The size and uptime of your Amazon Redshift cluster or the compute used by Redshift Serverless.
- Query Volume: The amount of data scanned by Amazon Athena queries.
- Data Transfer: Costs for moving data between AWS regions or out to the internet.
- Dashboard Usage: The number of authors and readers using Amazon QuickSight.
You can find detailed, up-to-date information on the official pricing pages for Amazon S3, AWS Glue, Amazon Redshift, and Amazon QuickSight.
Choosing the Right Implementation Partner
The right partner can significantly accelerate your success. Look for a partner with:
- Proven AWS Architecture Experience: They should be an AWS Advanced or Premier Tier partner.
- Deep Data Engineering Skills: Expertise in services like Glue, Redshift, and S3.
- BI & Semantic Modelling Expertise: The ability to translate business needs into effective data models and dashboards.
- ERP and Source System Integration: Experience connecting to systems like SAP, Oracle, and other line-of-business applications.
- Strong Governance and Security Pedigree: A documented approach to building secure and compliant solutions.
- Industry Knowledge: Understanding of your specific sector, whether it's BFSI, manufacturing, or IT services.
When evaluating partners, consider their credentials as part of your due diligence. For example, Cygnet.One holds certifications like SOC 2 Type II compliance and CMMI Level 5, and has completed over 250+ ERP integrations, demonstrating a mature capability in delivering secure, enterprise-grade solutions.

Frequently Asked Questions
How much does a managed service provider cost?
Cost depends on scope: data volume, number of sources, support coverage (for example, 24/7), security needs, and whether you need one-time implementation or ongoing operations. Provider fees are separate from your direct AWS consumption charges.
What are Azure managed services?
Azure managed services refer to the ongoing management of environments on Microsoft's Azure cloud platform. This article focuses on data warehouse and BI services within the AWS ecosystem, which offers a comparable but distinct set of tools.
What is a Microsoft managed service provider?
A Microsoft managed service provider (MSP) specialises in supporting Microsoft technologies like Azure, Microsoft 365, and Dynamics. This is different from an AWS-focused data and analytics partner, who would have deep expertise in services like Amazon Redshift and AWS Glue.
What are examples of managed services?
Common examples include infrastructure monitoring, security management, backup and disaster recovery, data engineering, platform optimisation, and incident response. Implementation of a new AWS BI platform and the ongoing managed analytics services for it may be treated as separate scopes.
What are examples of Azure services?
Azure's service categories include compute, storage, databases, analytics, and security. These are broadly analogous to AWS service categories, with specific services like Azure Synapse Analytics competing with Amazon Redshift and Power BI competing with Amazon QuickSight.