Introduction
Managing cloud costs across multiple providers has become one of the hardest problems in enterprise IT. According to the Flexera 2026 State of the Cloud Report, 85% of organizations cite managing cloud costs as their top cloud challenge — and an estimated 29% of IaaS and PaaS spend is wasted.
Multi-cloud environments amplify this problem. AWS, Azure, and GCP each price resources differently, bill on different cycles, and report costs through separate dashboards. The result: finance teams lose visibility, engineers overprovision without realizing it, and monthly bills arrive with line items nobody expected.
This guide breaks down why multi-cloud costs spiral, what practices actually control them, and which tools and vendors are worth evaluating.
TL;DR — Key Takeaways
- Multi-cloud pricing fragmentation makes cross-cloud cost comparison nearly impossible without dedicated tooling
- Consistent tagging and centralized dashboards are the foundation of any effective optimization program
- Commitment-based pricing (reserved instances, savings plans) can cut compute costs by up to 72% for predictable workloads
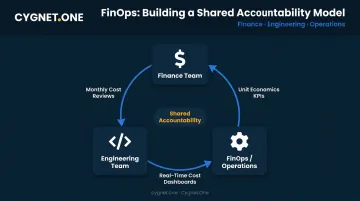
- FinOps delivers results only when finance and engineering share accountability — adopting tools alone isn't enough
- Track three core KPIs: cost per workload, waste rate, and forecast accuracy
Why Multi-Cloud Costs Spiral Out of Control
Incompatible Pricing Models Across Providers
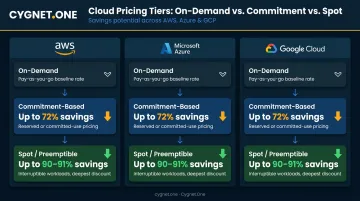
No two hyperscalers price the same way. AWS bills EC2 by the second (60-second minimum) with four purchase options: on-demand, savings plans, reserved instances, and spot. Azure charges by the full minute with its own savings plan and reserved VM instance structures. GCP uses one-minute minimums with per-second billing after that, plus sustained-use discounts that apply automatically.
Each provider offers significant commitment discounts:
- AWS Savings Plans: up to 72% vs. on-demand
- Azure Reserved VM Instances: up to 72%
- GCP committed use discounts: up to 70% (resource-based)
These figures use different baselines, commitment structures, and flexibility rules. Comparing them across clouds without purpose-built tooling is genuinely difficult.
Beyond commitments, spot and preemptible instances offer deeper discounts: AWS EC2 Spot runs up to 90% below on-demand, GCP Spot VMs up to 91%. Teams that don't actively manage these options are paying full price for capacity they could secure at a fraction of the cost.
The Visibility Gap
When cloud resources aren't consistently tagged — by team, project, environment, or application — finance teams have no reliable way to attribute spend. The result is predictable:
- Orphaned resources accumulate (old snapshots, unattached volumes, forgotten dev environments)
- Shadow IT deployments go undetected until the bill arrives
- Overprovisioned instances run for months without anyone noticing
The FinOps Foundation KPI library tracks Untagged Resources Percentage as a primary governance metric precisely because untagged resources are the single biggest source of uncontrolled spend. Without allocation coverage, optimization is guesswork.
Hidden Costs That Catch Enterprises Off Guard
Beyond compute, several cost categories regularly surprise finance teams:
- Data egress fees: AWS charges up to $0.09/GB for internet data transfer out; GCP's Premium Tier starts at $0.12/GiB. These add up fast for organizations replicating data across clouds for disaster recovery or running AI/ML pipelines
- Cross-region transfer charges — moving data between availability zones or regions within the same provider incurs separate fees
- Idle development environments — non-production instances left running over weekends compound quickly
- Per-cloud security and compliance tooling — maintaining separate SIEM, vulnerability management, and audit logging on each cloud adds operational overhead that rarely appears in initial cost projections
Enterprises running high-volume finance or compliance workloads — such as e-invoicing or tax processing platforms — should treat egress and cross-region transfer as explicit budget line items, not incidental costs.
Multi-Cloud Cost Optimisation: Best Practices
Establish Unified Cost Visibility Through Tagging and Allocation
A consistent, organization-wide tagging strategy is essential from day one. Every resource should carry tags identifying at minimum: team, project, environment (prod/dev/staging), and application. Without this, you cannot accurately attribute spend, and you cannot optimize what you cannot measure.
Once tagging is in place, centralized cost dashboards (whether cloud-native or third-party) consolidate billing data from all providers into a single view. Finance teams see actual spend by business unit, while engineering teams see the cost impact of architectural decisions. Both groups work from the same data.
The FinOps Foundation defines Allocation Coverage as (Allocated Cloud Spend / Total Cloud Spend) * 100. Mature organizations target near-100% allocation coverage as a baseline.
Rightsize Resources and Eliminate Idle Workloads
Rightsizing means analyzing actual CPU, memory, and network utilization over at least two weeks, then downgrading instances running well below capacity. AWS Cost Explorer provides rightsizing recommendations directly; AWS Cost Optimization Hub surfaces broader opportunities including EC2 rightsizing, Graviton migration, and idle resource deletion.
Idle resource cleanup is just as impactful:
- Schedule non-production environments to shut down evenings and weekends
- Delete unattached storage volumes on a regular cadence
- Remove outdated snapshots that accumulate silently
The waste problem is significant at scale. Flexera estimates 29% of IaaS and PaaS spend is wasted across the industry.
Cygnet One's cloud modernization engagements show what targeted optimization delivers in practice: one digital lending client achieved a 30% reduction in AWS spend through automation and monitoring frameworks, while a banking client cut long-term storage costs by 50%.
Use Reserved Instances, Savings Plans, and Spot Pricing
Use a three-tier approach to compute pricing:
| Workload Type | Pricing Strategy | Potential Savings |
|---|---|---|
| Stable, predictable (24/7 services) | Reserved instances or savings plans | Up to 72% vs. on-demand |
| Fault-tolerant, interruptible (batch jobs) | Spot/preemptible instances | Up to 90-91% vs. on-demand |
| Unpredictable or short-lived | On-demand | Baseline |
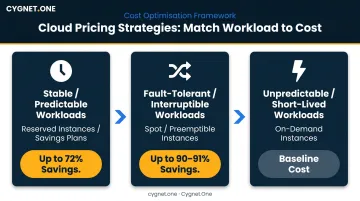
The risk with commitment-based pricing is over-committing. If you reserve capacity for workloads that shrink or disappear, you pay for unused instances. Start conservatively : use 60-70% of historical baseline usage as your commitment anchor, then adjust quarterly as actual patterns become clearer.
Automate Scaling and Cost Controls
Autoscaling is one of the most direct paths to cost reduction. All three major providers offer it natively:
- AWS Auto Scaling adjusts capacity automatically to maintain performance at the lowest possible cost
- Azure Monitor Autoscale triggers scaling based on metrics, schedules, or both
- GCP Managed Instance Groups add or delete VMs based on load; GKE Autopilot handles Kubernetes node provisioning automatically
Cygnet One's implementation for a Tax Compliance MSP handling peak API traffic during filing deadlines used EKS Horizontal Pod Autoscaler triggered at 80% CPU usage, achieving 99.95% application availability while keeping costs tied directly to actual demand.
Beyond scaling, automate the controls that catch runaway costs:
- Budget alerts that notify teams before thresholds are breached
- Anomaly detection that flags unusual spend spikes immediately
- Automated deletion of idle resources after a defined period of inactivity
Optimize Data Egress and Cross-Cloud Transfer Costs
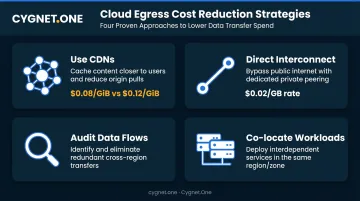
Egress fees are consistently the most surprising line item on enterprise cloud bills. AWS charges $0.09/GB for data transfer out to the internet (after a 100 GB/month free allowance). GCP's Premium Tier starts at $0.12/GiB , which is higher than both AWS and Azure for comparable regions.
Practical strategies to reduce egress spend:
- Use CDNs for content delivery (Google Cloud CDN egress to North America starts at $0.08/GiB vs. $0.12/GiB for direct VPC egress)
- Prefer direct interconnect options where available (AWS Direct Connect outbound rates start at $0.02/GB, well below standard internet egress tiers)
- Audit data flows to identify redundant cross-region transfers and eliminate them
- Co-locate workloads that exchange large data volumes in the same region or availability zone
Regularly Review Cloud Commitments and Workload Placement
Cloud cost optimization is an ongoing discipline, not a one-time project. Workloads change, usage patterns shift, and reserved capacity that made sense six months ago may no longer align with current demand.
Recommended review cadence:
- Monthly: Check for anomalies, verify budget variance, review new waste accumulation
- Quarterly: Assess reserved capacity utilization, evaluate workload placement, adjust savings plan commitments
- Annually: Review overall cloud architecture decisions and provider mix
Workload placement itself is a cost lever. High-utilization, stable workloads may deliver better economics on dedicated or private cloud infrastructure, while variable, bursty workloads belong on public cloud for elasticity. Getting this mix right requires regular reassessment and should be built into standard operational reviews.
Top Vendors and Tools for Multi-Cloud Cost Optimisation
When evaluating a cost management platform, look for these core capabilities:
- Unified cost data model across AWS, Azure, and GCP
- Real-time anomaly detection and alerting
- Forecasting, budgeting, and commitment tracking
- Tagging and cost allocation support
- Integration with existing DevOps or finance workflows
Native Cloud Tools
Each hyperscaler offers built-in cost management — useful for single-cloud environments, but limited for multi-cloud:
- AWS Cost Explorer — usage trends, reserved instance recommendations, amortised cost views, savings plans analysis
- Azure Cost Management + Billing — budget alerts, rightsizing suggestions, Copilot-assisted cost analysis in the Azure portal
- GCP Cost Management — billing export, budget alerts, committed use discount tracking, optimisation recommendations
These tools provide a solid starting point. For true cross-cloud visibility, a third-party platform is generally needed.
Third-Party FinOps Platforms
| Tool | Best For | Key Feature | Supported Platforms |
|---|---|---|---|
| Flexera One | Unified multi-cloud FinOps | AI-driven optimisation, license management | AWS, Azure, GCP |
| CloudZero | Unit cost visibility, Kubernetes cost allocation | Cost-per-customer visibility, container cost tracking | AWS, Azure, GCP, Kubernetes |
| Apptio Cloudability | Large enterprise financial management | Cost allocation, budgeting and forecasting at scale | AWS, Azure, GCP |
| Sedai | Autonomous cloud optimisation | Patented AI for rightsizing, predictive autoscaling, anomaly detection | AWS, Azure, GCP, Kubernetes |
| Cast.ai | Kubernetes-focused cost optimisation | Automated scaling across tens of thousands of clusters | AWS, Azure, GCP |
| Densify | AI-powered capacity planning | Continuously matches application demand to optimal cloud supply | GCP (confirmed), broader platforms available |
| AWS Cost Explorer | AWS-native cost analysis | RI recommendations, savings plans views, forecasting | AWS |
| Azure Cost Management | Azure-native cost management | Copilot integration, advisor recommendations | Azure |
AI-Driven Optimisation Tools
In high-change environments, workloads shift faster than manual rightsizing can follow. AI-driven tools close that gap:
- Sedai uses patented AI to lower costs, improve application performance, and increase availability autonomously
- Cast.ai automates Kubernetes scaling and rightsizing across multi-cloud clusters, backed by analysis of tens of thousands of real-world clusters
- Densify continuously matches application demand to optimal cloud resources using predictive analytics
For organisations where engineering teams carry broad responsibilities beyond cost governance, these tools are particularly useful — they enforce continuous optimisation without requiring dedicated FinOps headcount.
Enterprises with complex finance or compliance workloads should also verify how well any chosen tool integrates into existing finance and ERP systems. API compatibility, alerting granularity, and the ability to map cloud costs to specific business processes are practical requirements that vendor feature lists often understate.
Building a FinOps Culture and Governance Framework
The FinOps Foundation defines FinOps as "an operational framework and cultural practice that maximises the business value of technology, enables timely data-driven decision-making, and creates financial accountability through collaboration." The emphasis on collaboration is deliberate.
The most expensive cloud environments are often those where engineers make infrastructure decisions without cost context, and where finance teams receive bills they cannot explain or attribute.
Governance Policy Components
Effective governance relies on automation — manual policy enforcement breaks down at scale:
- Enforce tagging standards through policy — untagged resources should fail deployment checks
- Set departmental resource limits to prevent runaway provisioning
- Use policy-as-code tools — AWS Config for compliance assessment, Azure Policy for standards enforcement, GCP Organisation Policy Service for centralized resource control
- Establish approval workflows for unusually large resource requests before they're deployed
Cygnet One embeds FinOps practices into cloud modernization engagements from the architecture design phase — treating cost governance as a structural requirement, not an afterthought.
Building Cross-Team Feedback Loops
Policy controls set the boundaries — feedback loops keep teams accountable within them. Build in:
- Monthly cost review meetings with both finance and engineering present
- Cloud cost dashboards visible to all teams, not just FinOps leads
- Unit economics — cost per transaction, cost per API call — embedded into product and engineering KPIs
When engineers can see the cost impact of a deployment decision in real time, behavior changes — and over-provisioning becomes a conscious choice rather than a default habit.
Measuring Success: KPIs for Multi-Cloud Cost Optimisation
Measuring Success: KPIs for Multi-Cloud Cost Optimization
Cost per Workload / Unit Economics
Track the cost to support each application, service, or business process. These unit economics metrics connect cloud spend to business outcomes and reveal where architecture changes deliver the highest return:
- Cost per invoice processed — ties infrastructure spend directly to finance operations
- Cost per transaction — exposes scaling inefficiencies in payment or order workflows
- Cost per API call — flags over-provisioned integration layers or redundant service calls
At scale, these metrics surface efficiency gaps that aggregate billing data hides entirely.
Waste Rate and Utilization
The FinOps Foundation defines Cloud Waste Percentage as:
(Total Cloud Spend - Optimised Cloud Spend) / Total Cloud Spend
Industry benchmarks put current waste at 20–30% (IDC) to 29% (Flexera). Healthy organizations aim to get this below 10–15% through rightsizing, idle resource elimination, and commitment alignment. Track improvement quarter-over-quarter rather than targeting a single threshold — the direction matters as much as the number.
Budget Variance and Forecast Accuracy
Track actual vs. forecasted cloud spend month-over-month using the FinOps Foundation formula:
(Actual Cloud Spend - Budgeted Cloud Spend) / Budgeted Cloud Spend
Large variances signal either poor forecasting or unplanned usage spikes — both indicate where governance needs tightening. A practical starting point: target variance below ±10% month-over-month. Each organization should set this threshold explicitly and revisit it as cloud usage matures.
Frequently Asked Questions
What is multi-cloud cost optimization and why does it matter for enterprises?
Multi-cloud cost optimization is the practice of reducing waste and improving spend efficiency across two or more cloud providers. It matters because cloud bills consistently grow faster than initial projections — and without active management, 20-30% of that spend is wasted on idle or over-provisioned resources.
What are the biggest hidden costs in a multi-cloud environment?
Data egress fees, cross-region transfer charges, idle and orphaned resources, and over-provisioned instances are the most common culprits. Operational overhead — maintaining separate security and compliance tooling on each cloud — adds cost that rarely factors into initial planning estimates.
How does FinOps help with multi-cloud cost management?
FinOps creates shared accountability between finance, engineering, and operations teams, turning cost data into actionable decisions. It embeds cost optimization into how teams work day-to-day, so decisions happen continuously rather than in isolated reviews.
Which tools are best for multi-cloud cost visibility and optimization?
The right tool depends on scale and complexity. Native tools (AWS Cost Explorer, Azure Cost Management) work for single-cloud basics. For unified visibility and automation across multiple providers, platforms like Flexera One, CloudZero, and Sedai are better fits for enterprise environments.
How do reserved instances and savings plans reduce multi-cloud costs?
Commitment-based pricing offers up to 72% savings vs. on-demand rates for predictable workloads, in exchange for 1-year or 3-year usage commitments. The trade-off is accuracy: over-committing to capacity you don't use means paying for unused reservations, so start conservatively with historical data.
How often should organizations review and audit their multi-cloud spending?
Monthly reviews catch anomalies and trends. Quarterly assessments evaluate workload placement and commitment alignment. Annual strategic audits address broader cloud architecture decisions and provider mix. Each cadence serves a distinct purpose, and all three work together to maintain full cost control.