Introduction
Most enterprises can pull their AWS bill in seconds. Ask them the true cost of a single workload running across public cloud, private infrastructure, and on-premises hardware — and the number falls apart fast.
This isn't a reporting problem. It's a structural one. Hybrid environments combine fundamentally different billing models, metering systems, and cost ownership structures. Without a unified view, optimizing spend in one environment shifts waste to another.
2026 has sharpened the urgency in three specific ways:
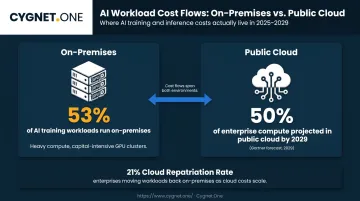
- AI workloads are splitting GPU-intensive training on-premises and inference in public cloud, creating cost flows that no single billing system captures
- Cloud repatriation is adding on-premises capacity back into already-complex environments
- Rising compliance requirements are duplicating audit overhead across every environment a workload touches
This guide gives IT leaders, CFOs, and FinOps teams a structured approach to understanding, tracking, and optimizing spend across hybrid environments — not just within a single cloud bill.
Key Takeaways
- 73% of organizations now operate hybrid estates, yet most still manage costs environment by environment
- AI workloads and cloud repatriation are adding cost complexity that legacy tools weren't built to handle
- On-premises costs are systematically understated — facilities overhead rarely appears in IT line items
- Flexera's 2026 State of the Cloud report puts wasted cloud spend at 29% — recoverable with the right approach
- Without a unified cost data pipeline, rightsizing, chargeback, and AI cost attribution all produce unreliable results
What Is Hybrid Cloud Cost Management and Why Does It Matter in 2026?
Hybrid cloud cost management is the practice of tracking, allocating, and optimizing spend across public cloud, private cloud, and on-premises infrastructure as a single, unified financial picture. The challenge is that each environment uses different pricing models, billing formats, and metering logic — making apples-to-apples comparison difficult in practice.
The 2026 Inflection Point
According to Flexera's 2026 State of the Cloud report, 73% of organizations operate hybrid estates. The FinOps Foundation's 2026 survey confirms the shift: FinOps scope now includes private cloud for 57% of respondents and data centers for 48%.
Two trends are accelerating the complexity:
- AI workload placement: The Uptime Institute's 2025 AI Training Survey found that 53% of AI training workloads run in on-premises central data centers, while Gartner predicts 50% of cloud compute resources will be devoted to AI workloads by 2029. Many organizations are running training on-prem and inference in public cloud — creating cost flows that span both environments simultaneously.
- Selective cloud repatriation: Flexera reports 21% of cloud workloads have been repatriated, though IDC notes only 8–9% of companies plan full repatriation. This is workload-specific optimization, not a wholesale cloud exit — and it adds on-premises capacity back into environments that were already complex.
The Compounding Cost Problem
These two trends share a common financial risk: spend optimized in isolation doesn't disappear — it shifts.
Without a unified view, decisions made in one environment create hidden costs in another. Consider a common scenario:
- A team reduces public cloud compute spend by shifting workloads on-premises
- On-premises data replication costs rise to compensate
- Net savings: zero — the waste simply moved somewhere less visible
Cost decisions based on a partial view of actual spend will always produce incomplete savings. The environment you're not measuring is the one absorbing the slack.
Key Cost Components of a Hybrid Cloud Environment
Public Cloud Resources
Public cloud costs come from consumption-based IaaS, PaaS, and SaaS services across AWS, Azure, and Google Cloud. The pricing complexity alone is significant: each provider exposes SKU-priced catalogs through APIs (Azure's returns up to 1,000 records per request; Google's supports up to 5,000 per page), with discount tiers, regional variations, and commitment options layered on top.
AWS Savings Plans, for example, offer discounts of up to 72% versus On-Demand rates in exchange for one- or three-year compute commitments — but capturing those discounts requires at least 12 months of historical usage data and clear separation of stable versus experimental workloads. Most organizations don't have that data organized consistently.
Private Cloud and On-Premises Infrastructure
On-premises costs are capital-heavy and amortized: owned or leased data centers, colocated hardware, and virtualized private stacks. The deeper problem is that these costs are systematically understated — power, cooling, floor space, and staff overhead are frequently buried in facilities budgets, not IT line items.
The Uptime Institute's 2024 Global Data Center Survey confirms that cost pressure, including high prices for energy, equipment, and labor, is management's primary concern. 51% of operators report difficulty finding qualified candidates, particularly in electrical and mechanical roles — a staffing cost that rarely appears in any cloud cost comparison.
Integration and Orchestration Layers
The networking and orchestration layer between environments is typically the least visible cost center. Costs here scale directly with complexity — every new connection between environments adds ongoing expense.
Components that most commonly go untracked include:
- VPNs and dedicated interconnects between public and private environments
- API gateways managing cross-environment service calls
- ECS/EKS-based container orchestration clusters
- Terraform-managed infrastructure provisioning pipelines
- CI/CD pipelines and data replication jobs
Cygnet.One's cloud engineering engagements deploy these layers as standard parts of hybrid architecture builds. Cost attribution for each requires purpose-built instrumentation from day one — not as an afterthought.
Hidden Cost Drivers Most Organizations Miss
Inconsistent Cost Allocation Models
Public cloud bills at the API-call level. On-premises bills by the rack or VM. When a workload spans both, finance teams are reconciling two fundamentally different accounting systems. The result is systematic undercounting of on-premises costs and an inability to calculate true end-to-end workload cost.
Shadow IT and Untagged Resources
The FinOps Foundation defines an untagged-cost KPI as total costs associated with untagged resources divided by total cloud cost. Their recommended initial target: less than 10% — and even that's difficult because some resources are untaggable by design, such as shared networking components.
Untagged resources don't just create reporting gaps. They make it impossible to calculate the true end-to-end cost of any workload, which breaks every downstream optimization attempt.
Data Gravity and Egress Costs
Data doesn't move for free. Current provider pricing reflects this directly:
| Provider | Egress Rate (Standard) |
|---|---|
| AWS | $0.09/GB (after 100 GB/month free) |
| Azure | $0.087/GB (North America/Europe, after 100 GB free) |
| Google Cloud | $0.12/GiB (first 1,024 GiB, Premium Tier) |
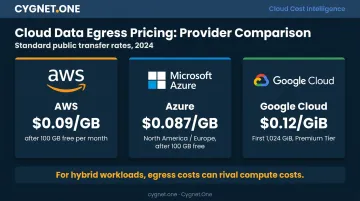
For organizations storing primary data on-premises but processing in the cloud — or vice versa — data movement costs can rival compute costs. As Forrester notes, egress fees have historically contributed to data gravity, making frequent communication between public cloud and on-premises data centers difficult to sustain economically.
Backup and Replication Sprawl
Disaster recovery requires data replication across environments. Storage costs are visible; ongoing transfer costs, snapshot management overhead, and neglected retention policies accumulate without triggering any alerts. The 2025 State of Backup and Recovery Report found:
- Cost is the biggest SaaS data protection hurdle for 24% of organizations
- More than 50% of businesses plan to switch primary backup solutions within a year due to cost and DR dissatisfaction
Compliance and Audit Overhead
Maintaining compliance across hybrid environments means running parallel audit processes, duplicating security tooling, and maintaining separate logging stacks. Every additional regulatory framework compounds that labor cost — without adding any business value.
Automation is where organizations recapture those hours. Cygnet.One's tax compliance platform integrates with 100+ ERP systems — including SAP, Oracle, and Microsoft Dynamics — to consolidate indirect tax workflows across hybrid environments. Documented outcomes include a bank saving up to 350 man-hours through automated indirect tax return filing and a frozen food company saving 1,000 man-hours via automated invoice management. Unified ERP integration directly reduces the compliance duplication that hybrid environments otherwise amplify.
4 Effective Strategies for Hybrid Cloud Cost Management
Unified Visibility and Cost Attribution
The first step is consolidating cost data from all environments into a single view with consistent tagging, allocation rules, and reporting cadence. This means connecting public cloud billing APIs, on-premises metering tools, and license management systems into one pipeline.
Most organizations underinvest here — and every downstream optimization depends on getting this right. The FinOps Foundation's allocation maturity model maps the gap concretely:
| Maturity Level | Cost Allocation | Latency |
|---|---|---|
| Level 0 | <30% allocated | >30 days |
| Level 4 | >90% allocated | <1 day |
Most hybrid environments sit somewhere between Level 1 and Level 2.
Continuous Rightsizing and Resource Optimization
Manual rightsizing doesn't scale across hybrid environments. By the time a team finishes reviewing one environment, the other has drifted. AI-driven optimization — learning workload behavior and adjusting resources based on real application data, not static rules — is the practical alternative.
The waste available to recover is significant:
- 29% of cloud spend is wasted, per Flexera's 2026 State of the Cloud report
- Workload optimization and waste reduction rank as the #1 priority for FinOps teams in 2026, according to the FinOps Foundation
Chargeback and Showback for Accountability
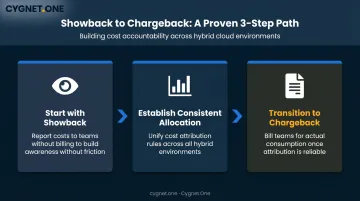
Showback reports costs to teams without billing them directly. Chargeback bills them for actual consumption. The practical recommendation:
- Start with showback — it builds cost awareness without political friction
- Establish consistent cost allocation across all environments first
- Transition to chargeback once teams are accustomed to visibility and attribution is reliable
Once attribution is reliable and teams understand their consumption patterns, governance policies become far easier to enforce.
Governance Policies and Cost Guardrails
Effective cost governance includes:
- Budget thresholds with automated alerts before limits are reached
- Tag enforcement at provisioning time (not as a reactive cleanup)
- Approval workflows for high-cost resource types
- Automated identification of resources exceeding usage baselines
Guardrails embedded in the provisioning process work. Governance applied as reactive cleanup doesn't — new resources accumulate faster than any team can manually review them.
Building a Unified Cost Data Pipeline Across Environments
Normalize Metrics Across Billing Models
Public cloud metrics — cost per compute hour, cost per GB stored, cost per API call — are well-defined. On-premises equivalents are not. Building a unified pipeline requires defining comparable normalized metrics that work across both billing models: cost per workload, cost per transaction, or cost per user.
Without normalization, cost data from different environments isn't comparable — and a single source of truth becomes impossible.
Real-Time Streaming vs. Monthly Batch Reporting
Monthly cost reports tell you what already happened. The FinOps Foundation's allocation maturity model puts the difference in concrete terms: Level 0 organizations see cost data more than 30 days after it's incurred; Level 4 organizations see it in less than one day.
Real-time cost streaming — where cost data updates continuously alongside performance and utilization data — lets teams catch anomalies within hours rather than weeks. CSP-native anomaly tools are typically threshold-based and often fall short in dynamic hybrid environments — a gap that pushes teams toward third-party tools with statistical and ML-based detection.
Single Source of Truth as an Organizational Goal
The goal is straightforward: a single dashboard, consistent allocation rules, and one reporting cadence that spans every environment. Organizations running separate cost tools for each platform — each with different tagging standards and reporting timelines — end up with data nobody trusts.
This is as much an organizational challenge as a technical one. For enterprises running complex ERP ecosystems alongside cloud infrastructure, unified financial platforms with deep ERP integration are often the practical path to consolidation. Without that layer, cost visibility stays fragmented across finance, ops, and engineering teams.
When Cost Data Should Trigger Architecture Changes
Practical triggers for workload placement reviews:
- Data transfer costs exceed 30% of total workload cost
- Steady-state workloads running on pay-as-you-go for more than six months
- Compliance overhead is duplicating labor across multiple teams for the same workload
A quarterly cost-per-workload review is a practical cadence for catching these signals before they compound.
A Practical Implementation Roadmap for 2026
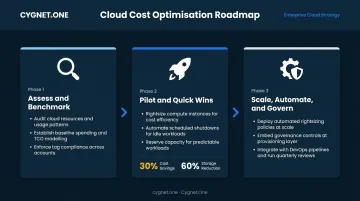
Phase 1 — Assess and Benchmark
Audit existing resources, establish baseline spending, and identify quick wins before acting.
Key activities:
- Evaluate resource utilization across all environments
- Audit tagging compliance against the FinOps 10% untagged threshold
- Map spending patterns and identify orphaned or idle resources
- Build a TCO model that includes facilities overhead, not just compute and storage
Cygnet.One's ORBIT framework structures this as the "Observe" phase — using AWS Well-Architected reviews, IAM and security posture evaluation, application dependency mapping, and cost-benefit analysis with TCO modeling. The deliverable is a prioritized transformation roadmap before any workload moves.
Phase 2 — Pilot and Quick Wins
With a clear roadmap in hand, choose a small number of high-impact, low-risk optimizations to prove value fast:
- Rightsize a specific set of over-provisioned instances
- Implement automated shutdown schedules for non-production environments
- Purchase reserved capacity for workloads with predictable, steady-state demand
Cygnet.One's cloud modernization engagements have delivered 30% cost savings through cloud-native restructuring and a 60% reduction in storage costs through AWS-native optimization. Those early results build the stakeholder confidence that larger governance programs depend on to secure continued investment.
Phase 3 — Scale, Automate, and Govern
Once pilots demonstrate measurable ROI, expand them organization-wide with systematic automation:
- Deploy automated rightsizing recommendations across environments
- Enforce governance policies and tag requirements at provisioning time
- Integrate cost optimization checks into DevOps and CI/CD workflows
- Establish monthly cost reviews and quarterly workload placement reassessments as operational rhythms
At this stage, cost discipline is no longer a discrete initiative — it's baked into how teams provision, deploy, and review infrastructure by default.
Frequently Asked Questions
What is hybrid cloud management?
Hybrid cloud management means governing, orchestrating, and optimizing resources across public cloud, private cloud, and on-premises infrastructure as a single operational model. It requires consistent policies, tooling, and visibility that span fundamentally different infrastructure types — something single-environment management never has to address.
How much does a hybrid cloud cost?
There's no single figure. Costs vary based on workload mix, environment sizing, data transfer volume, and compliance requirements. Most enterprises carry recoverable waste of around 29% (per Flexera 2026), and total cost of ownership spans compute, storage, networking, staff overhead, and compliance labor — not just cloud billing.
What are the 4 pillars of cost optimization?
The four commonly cited pillars are: visibility and cost attribution, rightsizing and resource optimization, governance and policy enforcement, and accountability through chargeback or showback mechanisms. In hybrid environments, unified visibility is the prerequisite that makes the other three possible.
What is the difference between hybrid cloud and multi-cloud cost management?
Hybrid cloud cost management spans public cloud, private cloud, and on-premises environments within one organization's infrastructure. Multi-cloud cost management primarily addresses spending across multiple public cloud providers. The two challenges frequently overlap in large enterprises running both.
How does FinOps help with hybrid cloud cost management?
FinOps brings finance, engineering, and operations teams under shared accountability for technology spend. As a practice rather than a product, it only delivers sustained savings when paired with automation — otherwise organizations gain detailed dashboards but no lasting reduction in waste.
What tools are commonly used for hybrid cloud cost management?
No single tool covers all hybrid environments. Most organizations build a connected stack: native provider tools (AWS Cost Explorer, Azure Cost Management), third-party platforms (Flexera One, Turbonomic, CloudZero), infrastructure monitoring, and tagging automation. The FinOps Landscape catalogs certified options across each category.