

































A ticket closed in six minutes means nothing if the employee needed forty minutes to recover their workflow.
That gap sits at the center of modern IT operations. Most managed service contracts still reward infrastructure uptime, response SLAs, and ticket volumes, but managed IT services now need to measure real employee experience. Yet users judge IT differently. They remember frozen video calls before a client’s presentation, VPN delays during month-end reporting, and restarting the same application three times before lunch.
The industry spent years measuring system health while ignoring human friction across modern cloud infrastructure management models. That approach no longer holds.
The conversation around end user experience monitoring has shifted from support optimization to business continuity. CIOs are beginning to ask a harder question: if systems appear healthy but employees cannot work smoothly, is IT actually performing well?
That question is driving serious interest in digital experience monitoring IT strategies. The focus is moving away from infrastructure dashboards toward lived user conditions. This is where UX-focused IT performance metrics become more valuable than traditional operational reporting.
Recent workplace studies point to the same issue from different angles.
- Nexthink reported that poor digital workplace experiences cost enterprises an average of 470,000 productive hours annually.
- HappySignals found that just 13% of IT tickets account for 80% of lost productivity.
Those numbers explain why many IT teams are revisiting their operating models.
Why Traditional IT Metrics Lost Their Edge
For years, managed IT success was tied to technical indicators:
- Server uptime
- Mean time to resolution
- Network availability
- Ticket closure rates
- Infrastructure utilization
These still matter. Nobody argues otherwise. But they fail to capture workflow disruption.
A finance employee waiting eight seconds for SAP to respond experiences delay differently than an infrastructure dashboard does. A remote developer dealing with unstable authentication failures feels the issue long before IT notices packet loss.
This is where end-user experience monitoring enters the discussion with more urgency than before.
The problem is not visibility. Most enterprises already collect massive telemetry streams. The real issue is interpretation. IT teams often measure machine behavior while business teams experience human interruption.
That distinction changes operational priorities.
A managed services provider may technically meet contractual SLAs while employees quietly create workarounds, move toward shadow IT, or delay tasks. One 2025 study found that digital inefficiencies cost large enterprises more than $100 million annually through lost productivity and workflow disruption.
The shift toward hybrid work made this harder to ignore as digital transformation changed how employees interact with enterprise systems. IT environments now stretch across personal devices, home networks, SaaS platforms, edge access points, and AI-assisted workflows. Static infrastructure monitoring cannot fully explain why user frustration keeps rising.
That is why digital experience monitoring in IT is gaining board-level attention.
The Real Meaning Behind End-User Experience Monitoring
Most articles explain tools. Very few explain operational intent. So before discussing platforms or dashboards, it helps to answer a more practical question: what is end-user experience monitoring in IT actually trying to solve?
It is the discipline of observing how users experience enterprise technology in real conditions. That includes latency, application response, device health, login friction, collaboration quality, workflow interruption, and behavioral patterns tied to productivity loss.
The important word there is experience. A healthy server does not guarantee a usable application. A closed ticket does not guarantee a recovered employee workflow.
Strong end-user experience monitoring practices combine technical telemetry with behavioral indicators. The goal is not more data collection. The goal is earlier operational context.
For example:
| Traditional Monitoring | Experience Monitoring |
| CPU usage crossed threshold | User could not join customer meeting |
| VPN tunnel active | Authentication took 47 seconds |
| Application available | User abandoned transaction midway |
| Ticket resolved | Workflow disruption continued |
That distinction matters because business damage usually begins before infrastructure failure becomes visible.
Many enterprises are now connecting UX-driven IT performance metrics directly to productivity outcomes. Instead of asking whether systems stayed online, they ask whether employees completed tasks without friction.
Why Monitoring Tools Are Changing Fast
Earlier monitoring platforms focused heavily on backend infrastructure. Modern platforms now combine device telemetry, application tracing, network intelligence, workflow analytics, and user sentiment data into one operational layer.
This is where digital experience monitoring tools that enterprise teams are adopting look very different from legacy observability products.
The strongest platforms now track:
- Device startup delays
- Application crash frequency
- Collaboration platform stability
- Wi-Fi consistency
- Login duration
- Browser session health
- User journey interruption
- Endpoint resource contention
Some even detect “silent frustration” patterns before tickets are submitted.
That matters because employees frequently stop reporting recurring issues altogether. There is a growing gap between “ticket resolution metrics” and actual user satisfaction.
This is exactly where digital experience monitoring in IT becomes operationally valuable. It reveals friction that standard service desks never capture.
More mature providers now correlate technical conditions with business moments through business analytics services. For instance:
- Was application lag affecting sales calls?
- Did endpoint instability impact payroll processing?
- Were customer support agents delayed during peak interaction windows?
That connection changes how managed services are evaluated. A provider managing uptime alone looks reactive. A provider managing workforce continuity looks strategic.
The Metrics That Actually Matter Now
The industry still has a habit of tracking what is easy instead of what is meaningful. That is why IT performance metrics UX deserves more attention than raw operational reporting.
The strongest IT teams now monitor combinations of technical and experiential indicators instead of isolated system statistics.
Here are the metrics gaining importance:
1. Time-to-Productivity After Incident
Not resolution time. Recovery time. There is a difference between restoring a system and restoring a person’s ability to work normally.
2. Application Friction Frequency
How often users experience lag, crashes, retries, or session abandonment. This has become central to end-user experience monitoring programs.
3. Digital Sentiment Trends
Short pulse surveys tied directly to incidents provide sharper operational insight than quarterly satisfaction surveys.
4. Workflow Interruption Rate
This is becoming a critical user experience KPI for IT teams because it measures operational disruption instead of infrastructure activity.
5. Device Stability Scores
Endpoint instability quietly drains productivity in hybrid work environments.
6. Collaboration Quality Metrics
Audio lag, screen-share failure, and conferencing instability now affect revenue-facing interactions daily. The point is operational clarity. This is also why many CIOs are reframing how we measure IT performance from the user’s perspective as a business metric rather than a support metric.
Once IT performance becomes tied to workforce continuity, executive attention changes immediately.
The Business Impact Nobody Talks About Enough
Most discussions around digital experience monitoring in IT stay trapped inside IT departments. That is a mistake. Poor digital experience directly affects revenue behavior, workforce retention, and operational trust.
Employees working through unstable systems create slower customer experiences. Slower customer experiences create business leakage.
That is why user-experience-focused IT KPI discussions are now entering leadership reviews instead of staying buried inside service operations.
The strongest managed service providers already understand this shift. They no longer position themselves as ticket processors. They position themselves as continuity operators.
There is another layer here that deserves attention. Poor digital experience often creates security problems.
Employees frustrated by unstable systems tend to bypass controls, install unauthorized applications, or avoid reporting issues altogether. Security researchers increasingly connect digital friction with risky employee behavior.
This gives end-user experience monitoring a second role beyond productivity: operational risk reduction.
A Smarter Way to Implement Experience Monitoring
Many enterprises make the same mistake during rollout. They deploy tools everywhere immediately, generate enormous telemetry volumes, and drown operations teams in noise. A better starting point is narrower. Begin with business-critical workflows. That approach produces cleaner operational insight and faster executive support.
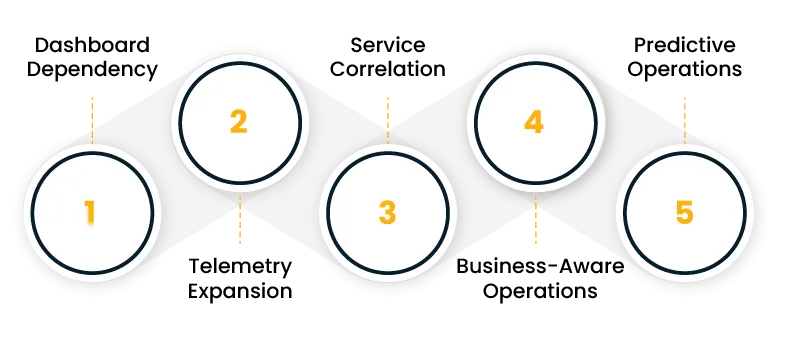
A practical rollout usually looks like this:
| Phase | Focus Area | Outcome |
| Phase 1 | High-friction workflows | Faster incident visibility |
| Phase 2 | Endpoint health baselines | Reduced recurring issues |
| Phase 3 | Workflow correlation | Business impact visibility |
| Phase 4 | Predictive remediation | Earlier intervention |
This is where end-user experience monitoring IT becomes easier to explain internally as operational intelligence.
The same logic applies while selecting enterprise digital experience monitoring tools that teams will use effectively. The best platforms are not necessarily the ones with the largest telemetry footprint. The useful ones provide context without operational clutter using data analytics consulting services.
Strong implementations usually share four traits:
- Clear ownership between IT operations and service management
- Baseline definitions for normal user conditions
- Workflow-focused alerting
- Executive reporting tied to business continuity
This is also where measuring IT performance from a user perspective becomes more actionable than broad infrastructure reporting. The discussion shifts from ‘systems are available’ to ‘employees are productive.’ That is a far stronger operational position.
Managed Services Are Being Judged Differently Now
The managed services market quietly changed over the last few years. Clients still ask about uptime and SLAs during procurement. But renewal conversations increasingly revolve around employee friction, workflow consistency, and operational responsiveness.
That shift explains why IT performance metrics UX is becoming part of contract discussions rather than remaining an internal reporting category. The providers gaining trust are usually the ones willing to expose uncomfortable truths:
- Which workflows create repeated user frustration
- Which departments experience hidden latency
- Which devices quietly drain productivity
- Which collaboration tools generate recurring instability
That honesty creates credibility and differentiation in a market crowded with providers selling identical operational language. The future of managed IT will not belong to providers with the most dashboards. It will belong to providers who understand how people experience technology minute by minute. That is the real value behind end-user experience monitoring. Not prettier reporting. Operational awareness that reflects real working conditions.
And once enterprises begin seeing IT through that lens, digital experience monitoring in IT stops being a support function discussion. It becomes a business performance discussion. That is exactly where the industry is heading.
Author


Yogita Jain
Content Lead
Yogita Jain leads with storytelling and Insightful content that connects with the audiences. She’s the voice behind the brand’s digital presence, translating complex tech like cloud modernization and enterprise AI into narratives that spark interest and drive action. With a diverse of experience across IT and digital transformation, Yogita blends strategic thinking with editorial craft, shaping content that’s sharp, relevant, and grounded in real business outcomes. At Cygnet, she’s not just building content pipelines; she’s building conversations that matter to clients, partners, and decision-makers alike.