
































Why change Challenges this solution is built to solve
Traditional financial statements can be delayed or unavailable for many MSMEs. GST data offers a current operating view, but extracting a defensible credit story from multiple returns and periods requires structured analytics.
Limited financial visibility
Collateral-light or thin-file businesses may not have timely audited financials for credit assessment.
Returns are difficult to interpret
Sales, purchases, tax liabilities and filing behavior sit across returns and periods.
Concentration and ecosystem risk
Dependence on a few buyers, vendors or inter-company transactions can distort apparent growth.
Slow manual reporting
Teams spend time downloading, comparing and summarizing GST data before credit review begins.
How it works From raw data to a governed business decision
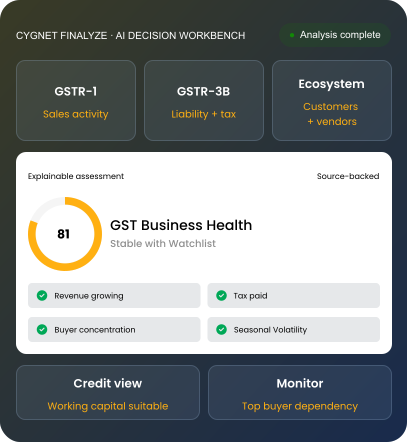
Cygnet Finalyze converts authorized GST data into normalized trends, ecosystem views and explainable business-risk signals.
Fetch data through consent-based GSP journeys, supported AA JSON or uploaded GST documents.

Standardize sales, purchases, liabilities, tax payments and filing information across periods.

Measure growth, seasonality, HSN mix, credit notes and operational consistency.

Identify top customers, vendors, inter-company activity and concentration exposure.
Create a business intelligence report, risk signals and API-ready data for underwriting or monitoring.

AI-first architecture Intelligence that understands, evaluates and acts
AI is used where it creates measurable value: structuring data, identifying context, detecting risk, explaining findings and routing exceptions, while keeping people and policy in control.
Layer 01 Verified GST Data Layer
Creates a consistent period-wise foundation from authorized GST filing and tax-payment data.
- Sales & purchases
- Tax liabilities
- Filing behavior
Layer 02 Business Pattern Layer
Detects growth, seasonality, concentration, unusual movements and ecosystem dependencies.
- Trend analysis
- HSN mix
- Buyer/vendor network
Layer 03 Credit Insight Layer
Summarizes operational health and prioritizes the signals that matter for working-capital decisions.
- Cash-flow proxy
- Risk flags
- Monitoring actions
Business impact Designed for BFSI, NBFCs and corporates
Use one intelligence foundation across lending, risk monitoring and counterparty assessment, with the workflow and controls required by each segment.
Banks & Financial Institutions
Apply the same intelligence foundation to the decisions and workflows that matter most to this
segment.
Priority use cases
- Assess MSME working-capital requirements
- Build cash-flow-led credit products
- Review industry, HSN and ecosystem patterns
- Monitor borrower operating performance periodically
What changes for teams
- Fewer manual preparation steps
- Consistent evidence and risk logic
- Exception-led analyst review
- Structured integration into existing systems
NBFCs & Digital Lenders
Apply the same intelligence foundation to the decisions and workflows that matter most to this
segment.
Priority use cases
- Pre-fill business assessment with authorized GST data
- Reduce manual return analysis and report preparation
- Use concentration and volatility in product policies
- Integrate results into fast digital journeys
What changes for teams
- Fewer manual preparation steps
- Consistent evidence and risk logic
- Exception-led analyst review
- Structured integration into existing systems
Corporates & Large Enterprises
Apply the same intelligence foundation to the decisions and workflows that matter most to this
segment.
Priority use cases
- Evaluate distributor and dealer business health
- Assess customer credit limits using operating trends
- Review vendor scale and concentration risks
- Support channel finance and supply-chain programs
What changes for teams
- Evaluate distributor and dealer business health
- Assess customer credit limits using operating trends
- Review vendor scale and concentration risks
- Support channel finance and supply-chain programs
Why Cygnet Finalyze Move beyond disconnected data tools
The differentiator is not AI as a label. It is verified data, specialized document intelligence, explainable risk logic and integration into the decisions your teams already make.

- Static financials that may be old
- Manual comparison of multiple GST returns
- Turnover-only view without ecosystem context
- Generic dashboards without risk prioritization
- One-time analysis during onboarding
- Current operating signals from authorised GST data
- Trend, seasonality and concentration intelligence
- Customer, vendor and inter-company ecosystem view
- AI-assisted summaries grounded in source data
- Refreshable reports for portfolio monitoring
Governed AI Enterprise control around every AI-assisted output
Support faster decisions without turning models into a black box. Review, override, trace and integrate outputs within your own governance model.
Consent-Based Journeys
Use authorized access routes appropriate to the data source and use case.
Source-Backed Insights
Trace trends and risk signals to period-wise filing data.
Configurable Thresholds
Set institution-specific growth, volatility and concentration rules.
Analyst Review
Allow users to validate context and annotate material findings.
Portfolio Controls
Apply common logic across borrowers while retaining product or segment variation.
Secure APIs
Integrate structured outputs into underwriting and monitoring systems.
- GSP / GST data journeys
- Account Aggregator
- LOS / LMS
- Credit decision engine
- CRM
- Data warehouse
- Portfolio monitoring
- REST APIs
Frequently asked questions Questions credit, risk and technology teams ask
It analyzes authorized GST sales, purchases, liabilities, tax payments, filing behavior, HSN mix, customer and vendor concentration, inter-company activity and period-wise trends.
No. GST BI is a deeper, consent-based business analysis report. The GRC Score uses publicly available filing signals for quick non-consent-based screening and monitoring.
It provides an operating and cash-flow proxy where financial statements may be delayed or limited, helping lenders assess business scale, trends and ecosystem risks.
Yes. It can show top customers and vendors, concentration levels and changes in the counterparty mix across periods.
Yes. Periodic refreshes can help detect revenue decline, tax-payment stress, filing deterioration or increasing concentration.
Yes. Reports and structured data can be integrated with LOS, LMS, decision engines, CRM and portfolio-monitoring systems through APIs.