

































A green availability dashboard can hide a system already drifting toward trouble. CPU queues may be lengthening, storage may be filling faster than forecast, backup jobs may be completing with unusable recovery points, and patch exceptions may be accumulating on business-critical servers. Nothing is technically “down” yet. Operating risk is still rising.
That is the gap enterprises need to close with managed infrastructure monitoring, supported by managed IT services that monitor infrastructure health, patch exposure, backup readiness, and incident risk. Uptime answers a narrow question: was the service reachable during the measurement window? A stronger IT infrastructure monitoring model asks how close the environment is to degraded performance, failed recovery, capacity exhaustion, or a security incident.
A useful way to read monitoring data is as distance to failure. The closer a resource gets to its operating boundary, the more valuable early intervention becomes. This shifts monitoring away from counting outages after they occur and toward recognizing the conditions that form before them.
Uptime Institute’s 2026 Annual Outage Analysis reports that 57% of respondents to its 2025 annual survey said their most recent major outage cost more than $100,000. Better visibility cannot remove outage risk, but it can give operations teams more time to intervene.
Why Is Uptime Alone a Weak Infrastructure Metric?
Uptime treats infrastructure as binary. A server, database, network path, or application endpoint appears available or unavailable. Enterprise environments rarely fail that cleanly.
Performance often degrades in stages. Storage latency climbs. Memory pressure increases. Network retransmissions rise. A patch remains pending because a dependency blocks deployment. Backup duration moves beyond the maintenance window. These signals can appear well before users report an obvious problem.
Google’s Site Reliability Engineering guidance uses latency, traffic, errors, and saturation as core monitoring signals. It also notes that latency increases can indicate approaching saturation before a resource reaches full utilization. That principle matters to managed infrastructure monitoring because it moves the discussion from “Is it running?” to “How safely is it running?”
This is where infrastructure health metrics become more useful than a single availability percentage. They show pressure, deterioration, imbalance, and recovery readiness across the operating environment.
For enterprises reviewing an enterprise monitoring strategy, one test is especially useful: can the monitoring model identify conditions that require action before users experience material disruption, especially across the top IT challenges enterprises face today? If the answer is unclear, the dashboard may be reporting status rather than operational health.
Which Infrastructure Health Metrics Should Enterprises Track?
A useful IT infrastructure monitoring program groups signals by the failure mode they can reveal. This prevents teams from collecting measurements without a clear operational purpose.
| Monitoring area | What to measure | What the signal can reveal |
| Compute | CPU run queue, memory pressure, swap activity, host contention | Resource stress before slow response |
| Storage | Free capacity, IOPS, queue depth, read/write latency, growth rate | Capacity exhaustion or storage bottlenecks |
| Network | Packet loss, retransmissions, interface errors, bandwidth use, path latency | Congestion, unstable links, routing problems |
| Patch health | Missing critical patches, deployment failures, overdue exceptions, reboot status | Exposure caused by incomplete maintenance |
| Backup health | Job result, recovery-point age, restore-test result, repository status | Recovery risk hidden behind successful jobs |
| Security | Authentication anomalies, privilege changes, endpoint alerts, configuration drift | Behavior that warrants investigation |
Each metric should map to a decision. A number that never changes an action is probably dashboard noise.
How Do Capacity and Saturation Expose Risk Before an Outage?
Traditional threshold monitoring often waits for a resource to cross a fixed limit. The more useful question is how fast the resource is moving toward that limit and whether the remaining headroom matches expected demand.
Capacity monitoring should track current utilization, rate of change, and usable headroom together. A storage volume at 72% utilization may be harmless if growth is flat. The same volume becomes urgent when consumption is accelerating and the next maintenance window is several days away.
Saturation adds another layer. A processor can report available capacity while request queues grow. Storage can remain online while I/O wait slows dependent applications. A network link can pass traffic while packet loss forces retries.
This is why latency and saturation metrics belong together. They show whether infrastructure is merely busy or beginning to affect service behavior. AWS exposes compute, disk, network, and related measurements through CloudWatch so teams can observe resource behavior over time.
A mature monitoring service interprets those relationships. High CPU may be normal during a scheduled processing job. High CPU combined with rising queue depth, longer response time, and increased errors deserves a different response.
What Should Patch Health Monitoring Actually Measure?
Patch reporting often stops at compliance percentage. That hides the difference between a low-risk workstation and an exposed production server supporting a revenue process.
NIST defines enterprise patch management as identifying, prioritizing, acquiring, installing, and verifying patches, and recommends continuous monitoring of the risk response after deployment. For IT infrastructure monitoring, patch health should be treated as an operating condition rather than a monthly administrative report.
Useful measurements include:
- Critical patches overdue by asset importance
- Failed deployments and repeated installation attempts
- Approved exceptions with expiry dates
- Systems waiting for reboot before remediation becomes effective
- Assets missing from the patch inventory
- Patch status changes after configuration or image updates
This is where proactive infrastructure management becomes visible in practice. Teams can prioritize an exposed server, investigate recurring deployment failures, or coordinate reboot windows before maintenance debt creates avoidable risk.
Why Backup Success Is a Poor Recovery Metric
A backup job can finish successfully and still leave the business underprepared for recovery. The copy may be too old, corrupted, inaccessible, incomplete, or dependent on credentials that fail during an incident.
Current NIST guidance on operational technology backups emphasizes regular creation, testing, recovery exercises, and integrity verification. Microsoft also provides backup monitoring around job failures, restore failures, protected-item health, and other warning conditions through Azure Monitor.
For managed infrastructure monitoring, backup status should answer four questions:
- Was the required data protected?
- Is the recovery point recent enough for the business requirement?
- Can the data actually be restored?
- Is the backup repository healthy and protected?
That is a stronger recovery view than a daily “success” count. IT infrastructure monitoring should surface recovery-point age, failed jobs, unusual backup duration, missed policies, restore-test results, repository capacity, and unexpected deletion activity.
During an incident, teams need to know whether recovery is viable before deciding whether to repair, rebuild, or isolate affected infrastructure.
Why Error Trends Matter More Than Error Totals
Error counts create noise when read without context. Ten failed requests might be irrelevant during a large batch operation and serious on a low-volume authentication service.
Trend direction is more useful. A gradual rise in timeout errors, disk retries, interface drops, failed health checks, or service restarts can reveal deterioration that a static threshold misses. Good monitoring looks for abnormal change against a known baseline, especially when several related signals move together.
This is where the second use of latency and saturation metrics becomes important. A small latency increase may mean little on its own. When it appears beside rising errors and shrinking headroom, the combined pattern can justify investigation before visible failure.
The same reasoning applies to capacity monitoring. Operations teams should care about time-to-exhaustion, uneven distribution, and demand patterns, not only the current percentage consumed.
How Should Security Signals Fit Into Infrastructure Monitoring?
Infrastructure operations and security monitoring often sit in separate tools, although the underlying events can describe the same problem.
A sudden privilege change, unexpected service creation, disabled logging agent, configuration drift, unusual outbound traffic, or backup deletion can be both an operational signal and a security signal. Separating those views too rigidly can slow diagnosis.
An enterprise monitoring strategy should define which security events require infrastructure action. The goal is to ensure changes that affect risk are visible to the people responsible for availability and recovery.
This improves the health view too. A system should be supportable, recoverable, patched, observable, and behaving within expected boundaries. A server can be online and still fail several of those tests.
How Does Proactive Monitoring Reduce Infrastructure Incidents?
Monitoring becomes proactive when it changes work before a failure ticket arrives, which is how enterprise managed IT services help connect alerts, ownership, runbooks, and preventive action. Alerts alone do not achieve that. The operating model needs ownership, thresholds tied to business impact, runbooks, escalation paths, and enough context to distinguish urgency from noise.
Effective proactive infrastructure management usually follows a short chain:
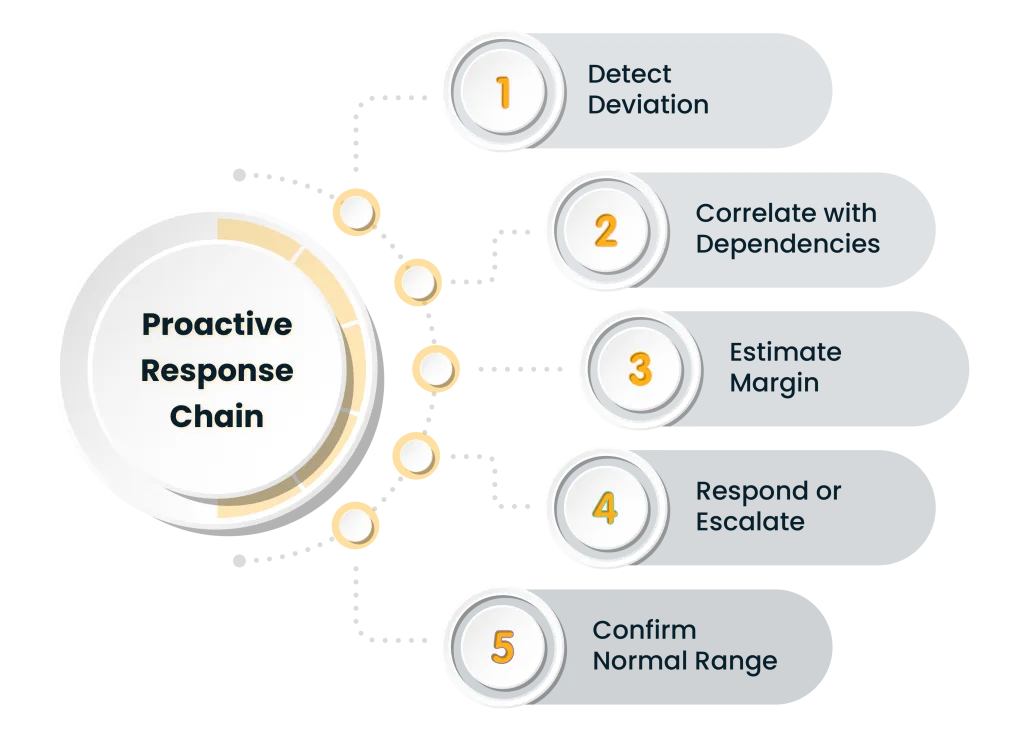
- Detect a meaningful deviation.
- Correlate it with dependent services and recent changes.
- Estimate the remaining operating margin.
- Apply a documented response or escalate with evidence.
- Confirm that the signal returned to an acceptable range.
This is the practical value of managed infrastructure monitoring. It creates time to extend storage, redistribute workloads, complete patching, repair a failed backup path, replace a degrading component, or investigate suspicious behavior before business impact widens.
For IT infrastructure monitoring, the most useful alerts are actionable and contextual. “Disk is 80% full” says little. “Critical database volume is projected to exhaust before the next approved maintenance window” gives the team a reason to act.
What Should Enterprises Expect From a Managed Monitoring Model?
Enterprises evaluating a provider should look beyond the monitoring toolset. Most platforms can collect CPU, memory, logs, events, and availability data. The harder part is deciding which signals matter, how they relate, who owns the response, and how weak patterns are investigated.
A strong managed infrastructure monitoring model should provide:
- Clear coverage across compute, network, storage, backup, patch, and security-related signals
- Alert logic based on service context and operating boundaries
- Trend review that identifies recurring pressure before incidents repeat
- Defined runbooks for common infrastructure conditions
- Reporting that separates technical noise from business-relevant risk
The provider should explain how thresholds are tuned. Static thresholds copied across dissimilar systems create alert fatigue and missed risk because different infrastructure types have different operating profiles.
A mature IT infrastructure monitoring practice treats monitoring as an operational discipline. Tools collect evidence. Engineers interpret it, connect it to service dependencies, and act on it.
The Better Question Is “How Close Are We to Failure?”
Uptime will remain part of enterprise reporting because availability matters. It should not carry the full weight of infrastructure health.
The stronger question is how much safe operating margin remains. That requires visibility into resource pressure, latency, errors, patch completion, backup recoverability, security-relevant changes, and the direction those signals are moving.
When enterprises use managed infrastructure monitoring this way, the dashboard becomes an early-warning system for where operating risk is forming. In parallel, IT infrastructure monitoring becomes more useful to engineering and business teams because it connects technical behavior with the likelihood of service disruption.
The best monitoring model does not celebrate a green screen. It explains what is becoming fragile while there is still time to fix it.
Author


Yogita Jain
Content Lead
Yogita Jain leads with storytelling and Insightful content that connects with the audiences. She’s the voice behind the brand’s digital presence, translating complex tech like cloud modernization and enterprise AI into narratives that spark interest and drive action. With a diverse of experience across IT and digital transformation, Yogita blends strategic thinking with editorial craft, shaping content that’s sharp, relevant, and grounded in real business outcomes. At Cygnet, she’s not just building content pipelines; she’s building conversations that matter to clients, partners, and decision-makers alike.