

































A practical lesson from support reviews is that weak operating models usually show themselves through workarounds that become normal. Tickets bounce because queue ownership is unclear. Senior engineers enter routine incidents because the runbook is incomplete. Recurring alerts stay open because root-cause work keeps losing priority.
The dashboard can still look respectable.
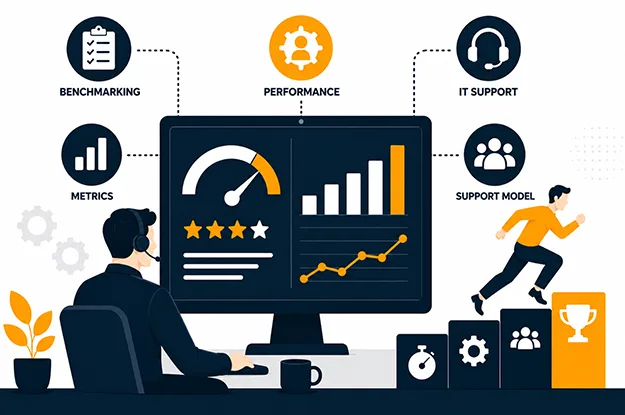
That gap between reported performance and the effort required to maintain it is where IT operations benchmarking becomes useful, especially when enterprises understand how managed IT services work beyond ticket closure. The aim is to compare how support actually works against a defined operating standard, then identify where manual effort, unclear ownership, weak knowledge, or poor recovery discipline is creating risk.
Uptime Institute’s 2026 Data Center Resiliency Survey gives this operational problem some context. In a question covering significant, serious, or severe outages experienced over the prior three years, 92% of respondents said human error contributed at least to some degree. The report also identifies failures to follow established procedures and inconsistent or unclear processes as common contributors.
For an enterprise reviewing managed IT maturity, the useful question is broader than “Are SLAs being met?” It is: how much hidden effort is required to meet them?
Why IT Operations Benchmarking Matters Beyond SLA Reports
SLAs measure contractual outcomes. They do not fully explain how those outcomes were achieved.
Consider two support teams with similar average resolution times. One reaches the correct owner quickly, follows a tested runbook, documents the fix, and closes the issue once. The other sends the ticket through several queues, relies on a senior engineer’s memory, restores service manually, and sees the same issue return next month.
The averages may look similar. The operating quality is very different.
Good IT operations benchmarking should therefore examine three layers:
- Outcome: Was the service restored within the agreed target?
- Flow: How much delay, reassignment, waiting, and manual coordination occurred?
- Dependency: Did resolution depend on a particular person, undocumented knowledge, or an improvised workaround?
This is also why peer comparisons need care. ServiceNow’s current benchmark documentation includes measures such as first-assignment resolution, reopened incidents, SLA attainment, and average time to resolution. It also warns that priority definitions can differ between participants. A benchmark only helps when the compared work is defined consistently.
A credible view of managed IT maturity starts with that discipline. Compare like with like, then study the work behind the metric.
How to Assess IT Support Maturity
An IT support maturity assessment should inspect how support actually functions, rather than treating the service desk as a collection of ticket statistics.
A useful model reviews five areas: response quality, automation, escalation, documentation, and resilience, similar to how enterprise managed IT services assess support maturity across ownership, reporting, and recovery.
| Area | Falling-behind signal | Mature operating signal | Evidence to review |
| Response quality | Fast acknowledgement, weak ownership | Correct routing and stable ownership | Reassignments, reopens, time to correct owner |
| Automation | Repeat work handled manually | Stable tasks handled consistently through automation | Manual touchpoints, exceptions, failed jobs |
| Escalation | Senior specialists pulled into routine work | Clear triggers for specialist involvement | Handoff count, engagement time, escalation age |
| Documentation | Fixes depend on individual memory | Runbooks reflect current systems and incidents | Article age, runbook usage, failed steps |
| Resilience | Recovery depends on improvisation | Recovery actions are tested and owned | Recovery tests, dependency maps, restore evidence |
This table is intentionally operational. It avoids maturity labels that sound impressive while hiding weak execution.
The same approach can anchor an IT service benchmarking framework. Rate each area from evidence gathered over a defined review period. The objective is to find friction that has become ordinary.
Which Support Metrics Reveal a Weak Support Model?
The most useful managed IT performance metrics are often the ones that expose wasted motion.
Average resolution time still matters, but it needs companion measures. Five are especially useful:
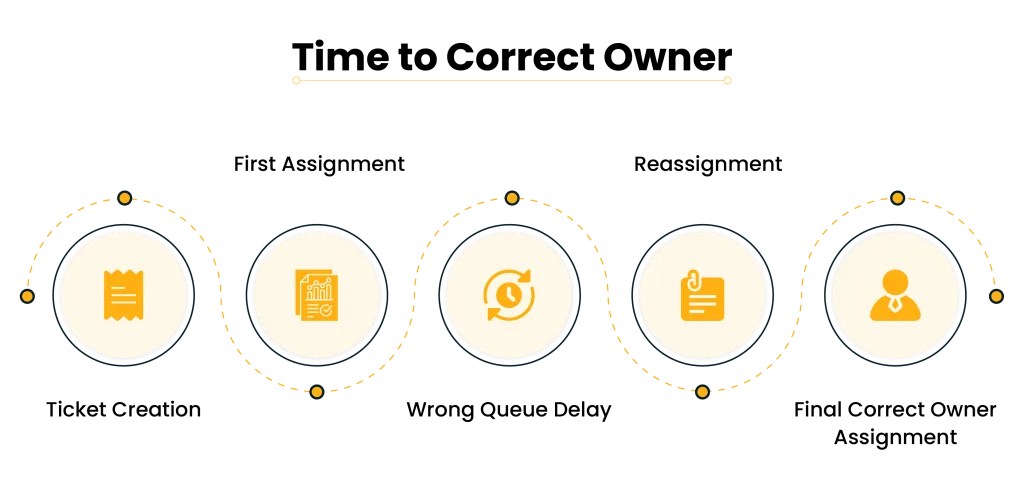
- Time to correct owner: Measure the time between ticket creation and assignment to the team that can actually resolve it.
- Reassignment frequency: Count how often incidents move between queues or teams before stable ownership is established.
- Reopen rate: Track issues that return after closure because the fix was incomplete, poorly validated, or misunderstood.
- Repeat incident rate: Identify recurring incidents tied to the same service, symptom, or root cause.
- Manual recovery dependency: Record incidents where restoration required an undocumented command, specialist memory, or one-off intervention.
If service restoration depends on a person remembering a specific sequence under pressure, the organization carries operational risk even when the incident closes within SLA.
This is where an enterprise IT operations assessment should move past service desk reporting. It should ask which parts of the support process would fail if the usual expert were unavailable.
That question reveals managed IT maturity more clearly than a polished monthly dashboard.
How to Benchmark Response Quality and Escalation
Fast response is useful. Correct response is better.
A support model starts to fall behind when acknowledgement is treated as ownership. The ticket receives a quick first touch, then waits in the wrong queue while teams decide who should act. That waiting time is operational friction, even if the SLA clock has rules that make the report look acceptable.
A practical IT operations benchmarking review should trace a sample of incidents from creation to closure. Look for:
- Where ownership changed;
- Why the handoff happened;
- How long the ticket waited between teams;
- When the right specialist became involved;
- Whether the same path repeated across similar incidents.
Escalation quality also shows whether responsibilities are designed well. Google SRE’s incident-management guidance separates operational command, communication, and planning responsibilities during incidents and stresses clear ownership and live incident documentation. The principle applies beyond major incidents: ambiguity adds coordination time.
Higher managed IT maturity shows up when escalation changes the quality of the response. It should bring the right authority, context, or technical capability into the issue. If an escalation simply moves the same uncertainty to a more senior person, the underlying support design is still weak.
How to Benchmark Automation and Documentation
Automation counts are easy to present and easy to misread.
A support organization can automate many actions while engineers still spend hours correcting exceptions or checking failed jobs. The useful benchmark is dependable manual work removed from the process.
For each automated workflow, review four questions:
- Does it have a clear owner?
- Are failure conditions visible?
- Is there a defined fallback or recovery path?
- Does the workflow reduce repeat effort without creating additional support work elsewhere?
This is where IT operating model maturity becomes tangible. Automation should reduce dependency on memory and routine intervention while keeping accountability clear.
Documentation deserves the same scrutiny. Review whether runbooks are used during real incidents, reflect recent changes, and can be followed by a capable engineer without informal help.
Google’s SRE guidance on postmortems treats documented incident learning as an operational practice, with review, action items, and reuse of lessons across teams. Documentation has value when it changes future response.
A second IT support maturity assessment should therefore test usability, rather than document volume.
How to Benchmark IT Resilience Before an Outage
Resilience is difficult to judge from uptime alone. A quiet quarter may reflect good engineering, low incident exposure, or simple luck.
The better test is whether the organization can prove how recovery works.
An IT service benchmarking framework for resilience should examine evidence such as restoration tests, backup validation, dependency ownership, supplier failure procedures, incident command practices, and follow-up actions after disruption.
Ask practical questions. Can the team restore a critical service from its approved recovery source? Can it identify the last relevant change quickly? Does the on-call engineer know who owns an external dependency? Are recovery procedures retested after major system changes?
These questions assess readiness before pressure exposes weaknesses.
They also show whether support remains repeatable when conditions are difficult. The result should depend less on who happens to be available and more on clear roles, tested procedures, usable telemetry, and current knowledge.
How to Build an IT Operations Improvement Roadmap
Benchmarking should end with operating changes, rather than a maturity score that sits in a presentation.
Group findings by the type of operating problem they create:
| Priority | What it addresses | Typical actions |
| Remove immediate friction | Routing and ownership delay | Fix queue rules, stale assignments, duplicate alerts, and broken runbook steps |
| Reduce recurring effort | Repeat work and specialist dependency | Address recurring incidents, automate stable tasks, improve knowledge capture |
| Strengthen recovery discipline | Unproven recovery paths | Test restore procedures, clarify dependencies, and close incident actions |
The roadmap should also define how improvement will be measured. A useful enterprise IT operations assessment can compare the same indicators before and after changes: time to correct owner, repeat incidents, reassignment, runbook success, recovery test results, and specialist dependency.
This turns IT operations benchmarking into a management cycle. Baseline the work, change the operating condition, measure again, and keep the evidence.
When Does Managed IT Maturity Signal the Need for a Different Support Model?
Some gaps can be corrected inside the existing team. Others point to a structural mismatch.
If the same weaknesses remain after ownership, workflow, and documentation have been addressed, examine capacity and capability. Watch for after-hours coverage gaps, repeated dependence on a few specialists, weak automation administration, and too little time for problem management.
This is where managed IT maturity becomes relevant to sourcing decisions. The question is whether the current model can provide the required coverage, expertise, process discipline, and accountability at a sustainable operating cost.
A managed service provider should be assessed against the same evidence. Moving support to a provider does not correct unclear ownership or weak measures by itself.
Use managed IT performance metrics again when comparing the current model with a proposed one. Ask whether the proposed model can materially improve the weak points already identified, and how that improvement will be measured.
What Does a Mature IT Support Model Look Like?
A mature support model is easier to recognize in the work than in a maturity score.
Tickets reach the right owner with fewer transfers. Repeat incidents trigger problem work. Automation removes predictable manual effort. Runbooks survive staff changes, recovery procedures are tested, and post-incident actions reach closure.
That is the practical meaning of IT operating model maturity.
The final purpose of IT operations benchmarking is to expose the distance between reported service performance and actual operating discipline. If the dashboard says support is healthy while engineers rely on repeated workarounds, person-dependent knowledge, and manual recovery, the benchmark has found the real issue.
Strong managed IT maturity is present when reliable support comes from the design of the operating model rather than repeated rescue work. That is the standard enterprises should measure against.
Author


Yogita Jain
Content Lead
Yogita Jain leads with storytelling and Insightful content that connects with the audiences. She’s the voice behind the brand’s digital presence, translating complex tech like cloud modernization and enterprise AI into narratives that spark interest and drive action. With a diverse of experience across IT and digital transformation, Yogita blends strategic thinking with editorial craft, shaping content that’s sharp, relevant, and grounded in real business outcomes. At Cygnet, she’s not just building content pipelines; she’s building conversations that matter to clients, partners, and decision-makers alike.