




































A dashboard can be accurate, current, and still arrive too late to matter.
That problem appears in many analytics programs. Reports are built around available data, while the decisions they are supposed to improve remain loosely defined. A sales dashboard may show pipeline movement without clarifying when a regional leader should intervene. A maintenance model may predict equipment risk without specifying who can stop production, inspect the asset, or accept continued operation. Analytics exists, but its place in the operating process is unclear — a gap that structured data analytics services address by connecting insight delivery to the decisions and workflows that drive business outcomes.
This is where decision workflow mapping becomes useful. It starts with the decision itself, then works backward through the trigger, owner, inputs, possible actions, timing, and feedback required to improve it. Analytics workflow design then determines where a dashboard, alert, model, recommendation, or embedded insight should enter that sequence.
The distinction matters. Gartner reported in 2025 that only 22% of surveyed organizations had defined, tracked, and communicated business impact metrics for most data and analytics use cases — a finding that reflects the broader data analytics challenges modern teams face when connecting insight work to measurable business impact. Measuring impact was also a top challenge for 30% of chief data and analytics officers.
The real challenge is turning analytical insight into a clear business action.
Why Analytics Must Connect to a Real Business Decision
Analytics teams often begin with a subject area: revenue, churn, inventory, procurement, service performance, or risk. Business teams operate differently. They work through recurring choices.
- Should an order be expedited?
- Should credit be extended?
- Should a supplier issue trigger an alternate source?
- Should a maintenance window be brought forward?
- Should a campaign continue, pause, or receive more budget?
Each question has an owner, a time window, and a consequence. Analytics in business process becomes useful when evidence reaches that point before the choice is made.
This changes the framing. The stronger question is: which decision is being improved, and what information changes the action?
That question is the foundation of business decision mapping. It describes the decision in operational terms rather than as a reporting requirement.
A useful decision statement usually contains four parts:
- The recurring choice being made
- The condition that causes the choice to occur
- The role accountable for the final action
- The business outcome affected by the choice
This also exposes weak use cases early. If no action changes when the metric changes, the metric may still be informative, but it is not central to the decision.
Start With Recurring Decisions, Not Available Data
The first step in decision workflow mapping is to inventory recurring decisions across a process. Focus on choices that occur frequently, carry material impact, create delay, or depend on several inputs.
Consider order fulfillment. A traditional analytics project might begin with late-delivery data and build a service dashboard. A decision-led approach asks where lateness can still be prevented.
That usually reveals a chain of smaller decisions: whether inventory should be reallocated, an order should move to another warehouse, a carrier should change, or a customer should be contacted before the promised date.
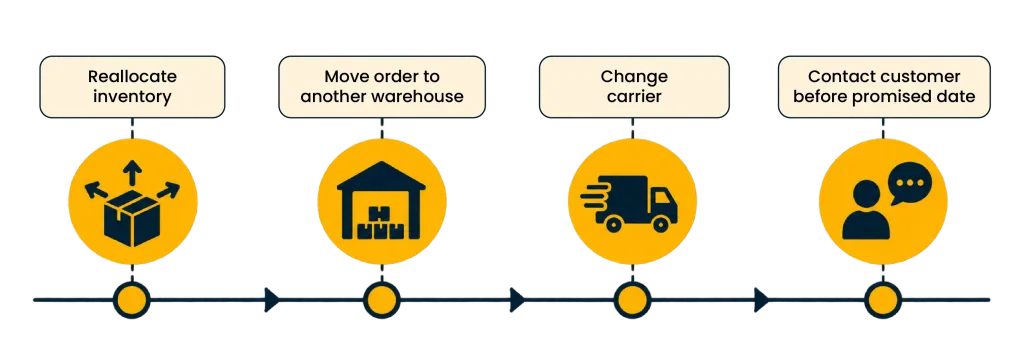
The value sits in those intervention points. Analytics workflow design should begin there, where evidence can still alter the next step.
A practical decision intelligence workflow can be documented with a simple structure:
| Element | Question to capture | Example |
| Decision | What choice must be made? | Reallocate inventory or keep the current plan |
| Trigger | What starts the decision? | Stock falls below expected order demand |
| Owner | Who is accountable? | Fulfillment manager |
| Inputs | What evidence matters? | Inventory, order priority, transit time, margin |
| Action | What can happen next? | Reallocate, expedite, split, or hold |
| Deadline | When does action stop being useful? | Before warehouse cut-off |
| Feedback | How is the result checked? | Delivery outcome and added fulfillment cost |
This table changes analytics workflow design by giving the analytics team a location, timing requirement, and decision consequence.
Decision Owner Mapping Prevents Orphaned Insights
A common analytics failure is an insight with no clear recipient. An alert may be visible to five teams while none has authority to act.
Decision owner mapping removes that ambiguity. Ownership should be assigned to the role that can authorize the action, rather than the role that happens to consume the report most often.
In cross-functional processes, the analyst who spots the issue may not own the response. Procurement may identify supplier risk while a category manager owns sourcing action. Finance may detect a margin issue while a commercial leader owns pricing.
Good ownership mapping also separates the person who selects the action, contributors who supply context, and execution owners who carry out the response. This prevents an insight from becoming a discussion with no accountable next step.
In decision workflow mapping, the owner also determines how information should be presented. A specialist may need detailed drivers and diagnostic evidence. An executive may need the business exposure, available options, and expected consequences of each option.
Triggers Matter More Than Reporting Cadence
Weekly reporting is convenient for reporting teams. Decisions rarely obey reporting calendars.
A pricing exception may need attention within minutes. Staffing may be reviewed daily, supplier performance weekly, and capital allocation monthly or quarterly — the full spectrum of cadences that real-time analytics capabilities must be designed to serve without forcing every decision onto the same reporting clock.
This is why trigger design belongs inside analytics workflow design. The trigger defines when analysis becomes relevant.
Triggers usually fall into four categories:
- Threshold triggers: A measure crosses an agreed limit.
- Event triggers: A business event occurs, such as a failed payment or delayed shipment.
- Prediction triggers: A model identifies a probability high enough to justify review.
- Scheduled triggers: A decision is made at a fixed business cadence.
The trigger should match the economics of the decision. Too early creates noise. Too late reduces the available action set.
This is especially important for operational analytics use cases, where the useful life of an insight can be short. A delay prediction after dispatch has far less value than the same prediction before routing is finalized.
Map Inputs by Decision Relevance, Not Data Availability
Once the decision and trigger are clear, the next task is to identify the inputs required to make the choice well.
Business decision mapping should separate inputs into three groups:
- Required evidence: Information without which the decision cannot be made responsibly
- Context: Information that changes how evidence should be interpreted
- Constraints: Policies, thresholds, budgets, service commitments, or regulatory conditions that limit available actions
This is where a decision intelligence workflow becomes more than a model pipeline. It connects analytical output with business rules, human judgment, and action boundaries.
The distinction becomes important when a model is technically sound but operationally incomplete. A risk score might rank accounts correctly while ignoring contractual conditions that prevent certain interventions — a limitation that mature AI predictive analytics implementations address by embedding business rules alongside model outputs rather than treating them as separate concerns. A forecast may identify a likely shortage but omit lead-time restrictions that determine whether replenishment is still possible.
Relevant evidence has to reflect the decision being made, not merely the information available in the analytical environment.
Decide Where Dashboards, Alerts, Models, and Embedded Analytics Belong
Different decision types need different delivery patterns. Putting every insight into a dashboard forces people to perform the final integration mentally.
The better approach is to match the analytical mechanism to the point of action.
| Decision condition | Best analytical fit | Why it fits |
| Regular review with several related measures | Dashboard | Supports comparison and discussion |
| Time-sensitive exception | Alert | Brings attention to a condition requiring action |
| High-volume prediction | Model score | Prioritizes cases for review or automated handling |
| Decision made inside an operational application | Embedded analytics | Keeps evidence close to the action |
| Complex choice with several trade-offs | Recommendation | Presents options using defined decision criteria |
This choice should be part of analytics workflow design, not a downstream interface decision.
The second use of analytics in business process should therefore be judged by proximity to action. The closer the insight sits to the actual decision, the less translation work is required from the user.
Placement also depends on decision frequency. A quarterly portfolio discussion can tolerate exploration across several views. A fraud review triggered during a transaction cannot. The analytics mechanism has to fit the time available for interpretation.
Add Action Paths Before Building the Interface
An insight without an action path creates interpretation work.
Before designing a screen, define what can happen after the insight appears. A risk indicator might allow investigation, reassignment, escalation, approval, rejection, or no action. Each choice may require different supporting evidence.
For example, a service manager reviewing repeated incident risk may need to inspect history, check for a known problem, assign investigation, approve preventive work, or record why no action is required. Those choices reveal where analytics belongs and where workflow capability matters more.
This mapping should happen before interface design. It separates the moment of insight from the mechanics of action, then reconnects them deliberately.
The distinction also protects against excessive automation. Some decisions can be automated within defined boundaries. Others carry financial, regulatory, customer, or safety consequences that require human judgment. The workflow should make those boundaries explicit before a model begins recommending action.
Feedback Loops Show Whether Analytics Changed the Decision
Many analytics programs measure report usage, dashboard views, or model accuracy. Those measures describe adoption or technical performance. They do not show whether the decision improved.
A stronger feedback loop records what was recommended, what action was taken, who took it, what outcome followed, and whether the result should change future decision logic.
For operational analytics use cases, this is especially important because conditions shift. A useful threshold can become noisy. A model can remain statistically accurate while producing recommendations that teams stop using. A workflow can add so many approvals that action arrives too late.
The feedback loop should answer three questions:
- Did the insight change the action?
- Did the action improve the target outcome?
- Did the result reveal a better rule, threshold, or input for future decisions?
This closes the loop between analytics workflow design and operating performance.
A fourth measure can also help: decision latency. The time between a meaningful signal and an approved action often exposes problems that model accuracy cannot. A correct recommendation delivered into a slow approval path may have little operational value.
A Practical Method for Prioritizing Decision Workflows
Not every decision deserves the same analytical investment. A useful prioritization model considers frequency, business impact, decision variability, data readiness, and actionability.
High-frequency decisions with clear actions are often good starting points. Decisions with no accountable owner or feasible response should usually be fixed operationally before advanced analytics is added.
A simple scoring discussion can use five questions:
- How often does the decision occur?
- What is the cost of a poor or late decision?
- Does better evidence change the available action?
- Can the outcome be observed after action?
- Is authority clear enough for the decision to proceed?
The last question matters more than it first appears. Better analysis cannot compensate for unclear accountability.
Decision owner mapping becomes particularly useful when several functions share responsibility for a process. It identifies where approval authority sits before technology is introduced into the workflow.
What Good Decision Workflow Mapping Changes
Good decision workflow mapping changes the unit of analytics work. The unit is no longer the dashboard, report, model, or dataset. It becomes the decision and the operating path around it.
That shift makes requirements easier to test, delivery choices more precise, and measurement more closely tied to outcomes.
It also makes weak analytics requests easier to challenge. A request for another dashboard can be traced to the decision it is meant to support. If the decision cannot be named, the requirement needs more work.
Gartner’s 2025 guidance on data and analytics trends made a similar move toward decision-centric thinking, recommending that organizations prioritize urgent business decisions for modeling and align decision intelligence practices around them.
There is a practical implication for analytics portfolios. Projects can be grouped around decisions instead of departments or datasets. Multiple reports that support the same decision may belong in one workflow. A single dashboard serving unrelated decisions may need to be separated.
This creates a clearer test for analytical value: whether the work changes the quality, timing, consistency, or outcome of a defined decision.
Build Analytics Into the Decision Process
Analytics earns its place when it changes a decision while there is still time to act — the standard that drives the most impactful data analytics use cases enterprises prioritize for roadmap investment.
That requires more than accurate data. It requires a clear decision, a trigger, an accountable owner, relevant inputs, realistic action paths, and a feedback loop that shows whether the choice improved the outcome.
Decision workflow mapping provides the operating structure. Analytics workflow design determines how analytical evidence enters that structure without adding unnecessary friction.
The result is a more disciplined way to choose analytics investments. Instead of asking where another dashboard could be built, the organization can ask where better evidence could change an important action. That question leads to better use cases, clearer ownership, and a stronger connection between analytics work and business results.
Author


Yogita Jain
Content Lead
Yogita Jain leads with storytelling and Insightful content that connects with the audiences. She’s the voice behind the brand’s digital presence, translating complex tech like cloud modernization and enterprise AI into narratives that spark interest and drive action. With a diverse of experience across IT and digital transformation, Yogita blends strategic thinking with editorial craft, shaping content that’s sharp, relevant, and grounded in real business outcomes. At Cygnet, she’s not just building content pipelines; she’s building conversations that matter to clients, partners, and decision-makers alike.