


Real-time analytics gives organizations the ability to act on data the moment it becomes available, closing the gap between an event and a decision. For most enterprises, that gap is wider than it should be.
Fraud alerts arrive after transactions settle, customer abandonment signals land in the next morning’s report, and equipment failures surface only after the production line stops.
The systems processing that data are built for hindsight, and that gap has real operational costs. According to Gartner’s 2024 D&A Survey, 61% of organizations are already evolving how they work with data, with decision speed emerging as the central driver.
This post covers how real-time analytics works, the core architecture that makes it function, how it compares to batch and streaming approaches, and where it is delivering measurable results across industries.
What is Real-Time Analytics?
Real-time analytics is the process of continuously collecting, processing, and analyzing data as it is generated to produce immediate, actionable insights. Unlike scheduled batch systems that accumulate data before acting, real-time analytics responds the moment data arrives.
It relies onstreaming data pipelines and event-driven processing architectures to detect patterns, trigger alerts, and update outputs within seconds or milliseconds. The system continuously computes on moving data, applying defined logic as each event flows through the pipeline.
This approach enables organizations to make time-sensitive decisions across fraud detection, patient monitoring, and logistics without the delay that traditional reporting introduces. Speed and data freshness are what distinguish it operationally.
How Real-Time Analytics Works: From Data Streams to Decisions
Real-time analytics runs data through a continuous pipeline, where each stage handles a specific job. From capturing raw events at the source to delivering insights where they’re needed, every component depends on the one before it.
Understanding what happens at each stage helps clarify what makes a system genuinely real-time, and where bottlenecks typically form.
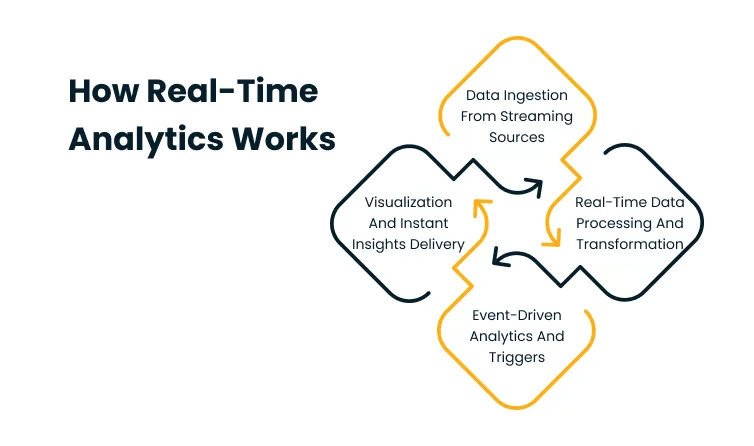
Data Ingestion From Streaming Sources
The pipeline starts at ingestion. Applications, IoT sensors, transactional platforms, user interfaces, and log-generating systems all produce data continuously. A retail platform logging clickstreams, a hospital monitoring patient vitals, or a factory tracking machine output are all generating high-velocity events in near-constant streams.
Event queues and streaming brokers act as the connective layer between data producers and the processing systems that consume them. They capture incoming data at high velocity and buffer it reliably during brief processing delays.
Without this layer, high-velocity data arrives out of order, gets dropped under load, or creates backpressure that stalls the entire pipeline.
Real-Time Data Processing and Transformation
Raw ingested data is rarely usable in its native form. Before analysis can occur, the incoming stream must be cleaned, filtered, and enriched, often within milliseconds.
This is where real-time data processing diverges most sharply from batch ETL. The transformation happens as data flows through the pipeline, eliminating the staging delay that batch systems introduce.
Stream processing systems apply windowing functions, aggregations, and enrichment rules dynamically. A window may capture events over the last 30 seconds to calculate a rolling risk score.
An aggregation may count failed login attempts across a session to flag suspicious behavior. The logic runs continuously, on moving data, without waiting for a batch cycle to trigger execution.
Event-Driven Analytics and Triggers
One of the most powerful aspects of real-time analytics is the shift from passive observation to automated action. Event-driven analytics establishes rules and thresholds that trigger automated responses when defined conditions are met.
When a transaction exceeds a risk score, a block fires:
- When a machine reading crosses a temperature threshold, a maintenance alert is dispatched.
- When a web session shows abandonment signals, a personalized intervention is triggered.
These responses operate without a human in the loop. The analytics system evaluates each event against a defined ruleset and routes an action based on the outcome. This closes the gap between detection and response that makes batch-based systems inadequate for time-critical use cases.
Visualization and Instant Insights Delivery
Processed results reach operations teams, customer-facing systems, and automated workflows through a delivery layer that takes several forms. Live dashboards update in seconds, giving teams continuous visibility into key metrics.
Alert systems route notifications to the right people or trigger downstream processes automatically. APIs push insights directly into operational applications, enabling in-app personalization, dynamic pricing adjustments, and real-time inventory updates.
The defining characteristic of this layer is that output follows data rather than a schedule. For organizations building these pipelines, the priority is ensuring that delivery speed matches the latency commitments of the upstream processing stages.
Real-time analytics is only as valuable as the decisions it enables, which makes it necessary to understand what those benefits look like in practice.
Benefits of Real-Time Analytics
Real-time analytics shifts organizations from reactive reporting to proactive decision-making, enabling faster, more informed actions across operations, risk management, and customer experience. The shift redefines what operations teams can know, and how quickly they can respond, at every layer of the business.
The operational impact compounds across functions:
- Faster decisions: Insights reflect current conditions rather than hours-old data, shortening the window between observation and action.
- Better customer experience: Personalization and recommendations driven by live behavioral signals respond to actual intent rather than stale profiles.
- Earlier risk detection: Anomalies surface before incidents escalate, enabling intervention before a problem becomes a failure.
- Higher operational efficiency: Automated responses to defined conditions replace manual monitoring across high-volume, time-sensitive workflows.
- More value from streaming data: Events that would otherwise be discarded before generating value are captured and acted on in real time.
In fact, according to IBM’s 2024 Cost of a Data Breach Report, organizations that deployed AI and automation extensively detected and contained security incidents 98 days faster than those without, reducing related breach costs by an average of $1.88 million.
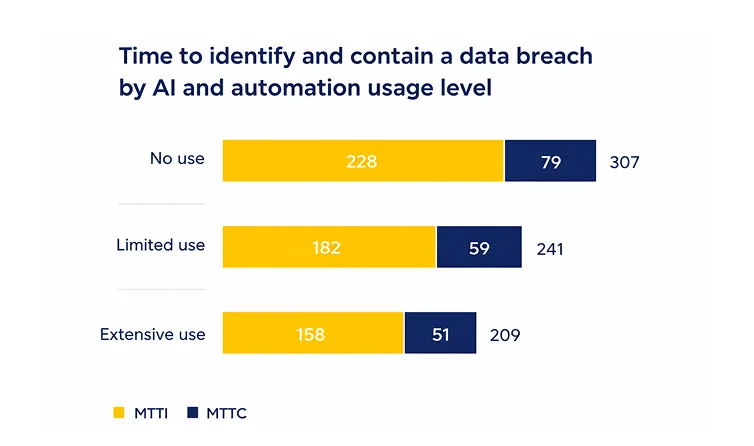
Image Source: IBM’s 2024 Cost of a Data Breach Report
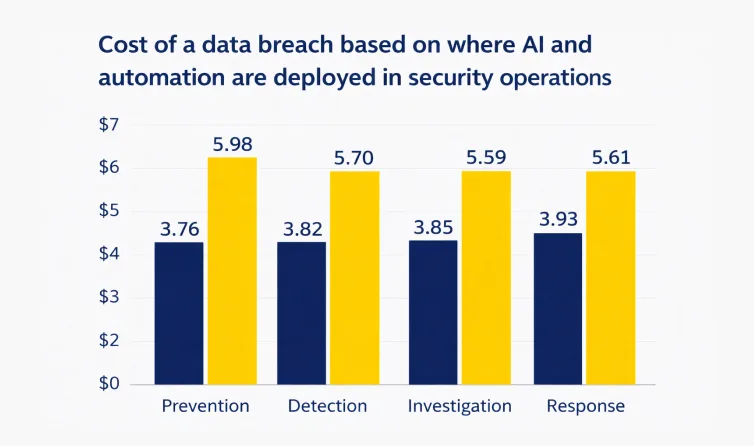
Image Source: IBM’s 2024 Cost of a Data Breach Report
This margin illustrates the operational value of systems that identify and act on anomalies in real time rather than retrospectively.
For organizations where a few seconds of delay translates directly into financial exposure or a missed opportunity, real-time analytics has become foundational infrastructure rather than a competitive edge.
How Real-Time Analytics is Different
Real-time analytics is often conflated with two related concepts, batch processing and streaming analytics. Understanding where each approach fits helps avoid architectural decisions that look similar on paper but produce very different operational outcomes.
Each approach solves a different problem. Selecting the wrong one has real architectural consequences, and the distinctions between them matter more in implementation than they do in theory.
Real-Time vs Batch Processing
| Aspect | Real-Time Analytics | Batch Processing |
| Data Processing | Continuous | Periodic |
| Latency | Seconds or milliseconds | Minutes to hours |
| Use Cases | Alerts, fraud detection | Reporting, historical analysis |
| Data Freshness | Always current | Delayed |
Batch processing has genuine value for retrospective analysis, regulatory reporting, and workloads where historical depth matters more than speed.
Real-time analytics handles decisions that must be made before the window closes. Whereas batch systems wait for a complete dataset before computing, real-time systems compute as data arrives.
Many enterprises run both in parallel, routing latency-sensitive workloads to real-time pipelines and using batch for downstream reporting and archival.
Real-Time vs Streaming Analytics
| Aspect | Real-Time Analytics | Streaming Analytics |
| Scope | End-to-end insights and actions | Processing streaming data |
| Focus | Decision-making | Data movement and processing |
| Output | Alerts, dashboards, actions | Processed data streams |
Streaming analytics handles the movement and transformation of data as it flows through a pipeline. Real-time analytics is the broader system that includes processing, analysis, and delivery of actionable outputs such as alerts, dashboards, and automated responses.
Streaming analytics powers real-time analytics. Treating the two as synonyms leads to implementations that process data efficiently but produce no decisions.
Architecture of Real-Time Analytics: Core Components
A real-time analytics system is better understood as a layered architecture where each component performs a distinct function, and no single layer provides end-to-end capability on its own.
The performance of the overall system depends on how well the layers are aligned. A fast processing engine cannot compensate for a bottlenecked ingestion layer, and understanding the architecture before selecting tools prevents the most common implementation failure modes.
Streaming Data Sources
Applications, IoT devices, sensors, manufacturing equipment, transactional platforms, and log-generating systems all produce continuous event streams. The defining characteristic is that data generation does not stop.
Events fire in response to user actions, physical readings, and system state changes around the clock. The architecture must be built to handle that flow, including volume spikes, from the source layer before data reaches downstream components.
Common streaming source categories include:
- Application event logs and user interaction streams
- IoT sensors and connected industrial equipment
- Financial transaction systems and payment processors
- Clickstream and behavioral data from digital platforms
Data Ingestion and Messaging Systems
Ingestion systems function as the high-throughput connective tissue between data sources and processing engines. Event brokers and message queues accept incoming data at high velocity, retain it reliably during brief processing delays, and deliver it to downstream consumers in order.
This layer absorbs volume spikes without data loss and decouples producers from consumers so that processing layer failures do not cascade upstream and disrupt the source.
Key functions this layer must perform:
- Buffer incoming events during downstream processing delays
- Guarantee ordered, at least once delivery across consumers
- Scale horizontally to match peak ingestion volumes
- Isolate producers from consumer failures
Stream Processing Engines
The stream processing layer is where raw events are shaped into usable analytical output. Filtering removes noise, aggregations compute metrics over defined time windows, and transformations enrich raw events with context from reference data.
The processing engine’s latency profile determines how closely the system’s outputs track real-world events. Poorly configured processing engines are the most common source of pipeline latency in real-time deployments.
Core processing operations include:
- Windowed aggregations over rolling or tumbling time intervals
- Stateful joins between event streams and reference datasets
- Pattern detection across sequences of events
- Real-time enrichment from lookup tables or external APIs
Storage Layers for Real-Time and Historical Data
Real-time analytics systems typically maintain two storage tiers. Short-term storage uses in-memory or fast-access stores to hold recent events for low-latency retrieval and active computation.
Long-term storage persists processed data in data lakes or warehouses for historical analysis, model training, and regulatory retention. The architecture must define which events go where, at what granularity, and for how long, balancing query speed against storage cost.
Storage tier considerations:
- In-memory stores for sub-millisecond reads on active computation windows
- Time-series databases for recent, high-frequency metric data
- Data lakes for raw event archival and retrospective analysis
- Data warehouses for aggregated historical reporting
Analytics and Visualization Layer
The analytics layer converts processed output into consumable form. Live dashboards surface real-time metrics, alerting systems notify teams when thresholds are crossed, and APIs route insights into downstream applications.
This layer is frequently underspecified in architecture design, treated as a presentation concern rather than a system requirement. The delivery speed of this layer must match the latency commitments made upstream.
With the architecture established, let’s look at how this plays out across real-world industries.
Use Cases of Real-Time Analytics Across Industries
The same architectural pattern underlies real-time analytics deployments across industries. What changes is the nature of the event, the threshold that triggers a response, and the team acting on the output.
The following use cases illustrate how organizations translate that capability into concrete outcomes across high-stakes environments.
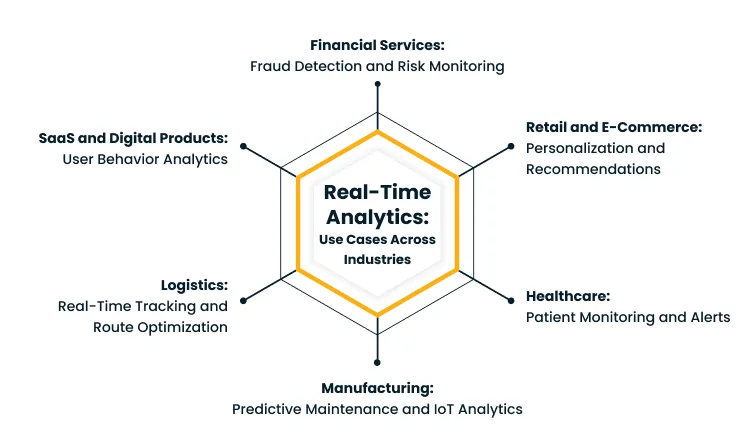
1. Financial Services: Fraud Detection and Risk Monitoring
Financial institutions process millions of transactions per day, and fraudulent events are embedded within that volume at a rate too high for manual review. Real-time analytics evaluates each transaction against behavioral baselines and velocity rules, triggering a block or alert before the transaction settles.
In fact, according to Deloitte’s 2024 FSI Predictions, AI-enabled fraud in the US is projected to grow from $12.3 billion in 2023 to $40 billion by 2027. Organizations that identify suspicious activity in milliseconds significantly narrow that window of loss.
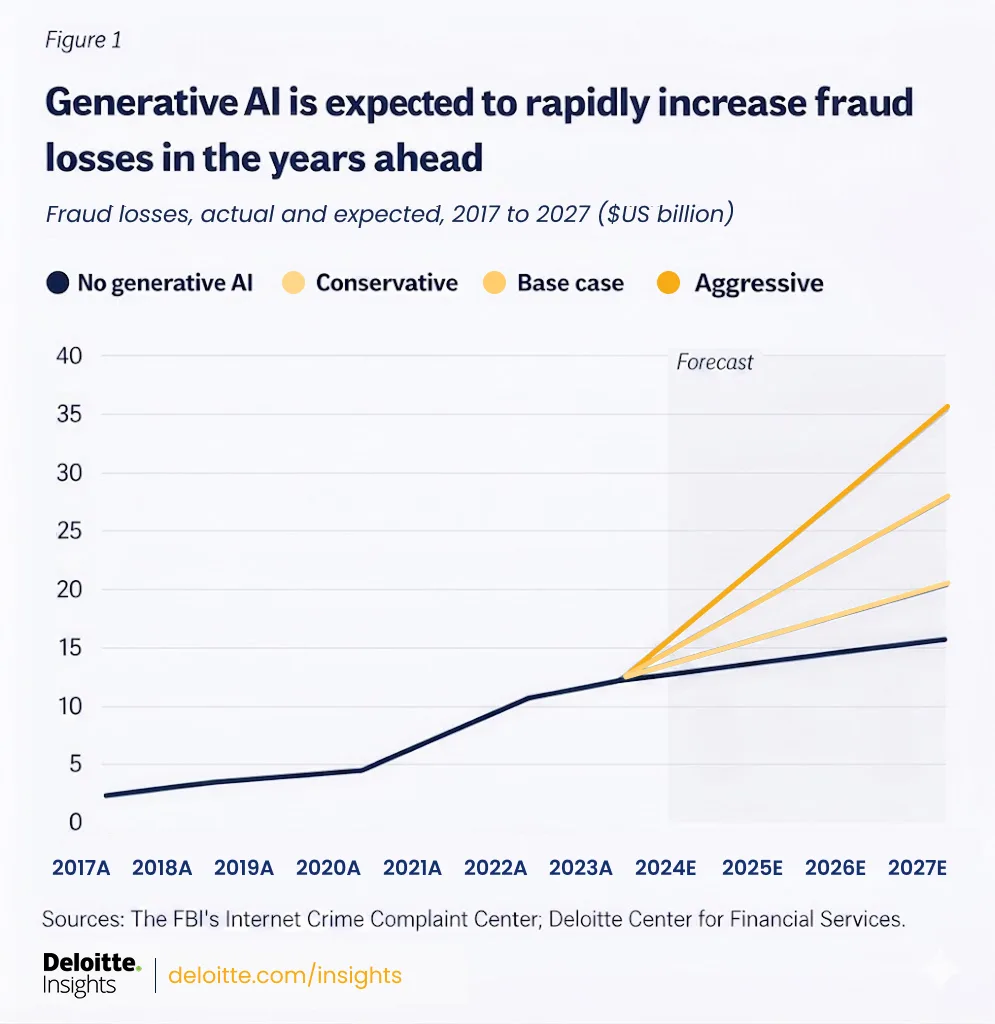
Image Source: Deloitte’s 2024 FSI Predictions
2. Retail and E-Commerce: Personalization and Recommendations
Customer behavior on a digital platform changes with every click, scroll, and search. Waiting for overnight batch processing to update recommendation models means serving yesterday’s intent to today’s visitor.
Real-time analytics tracks session behavior as it unfolds, feeding personalization engines with current signals. Recommendations update within the session, and promotional triggers fire at the moment engagement signals appear.
The outcome is a measurable lift in conversion rates and a shopping experience that responds to the customer’s actual current intent.
3. Healthcare: Patient Monitoring and Alerts
Clinical environments generate continuous vital sign data from monitoring equipment attached to patients in ICUs, post-surgical wards, and remote care programs. Real-time analytics processes this stream against clinical thresholds defined by care protocols.
When a reading deviates, an alert routes immediately to the responsible care team rather than surfacing in a next-shift review. Beyond speed, the operational value lies in eliminating the gap between a deteriorating condition and a clinical response. For high-acuity patients, that gap determines outcomes.
4. Manufacturing: Predictive Maintenance and IoT Analytics
Industrial equipment does not fail without warning, as vibration, temperature, pressure, and current draw change measurably before a component reaches failure. Real-time analytics processes sensor streams from production equipment continuously, comparing live readings against normal operating envelopes.
When readings indicate early-stage degradation, a maintenance alert is generated before the failure occurs. This shifts maintenance from a scheduled or reactive function to a condition-based one, reducing unplanned downtime and the production disruption that accompanies mid-run failures.
5. Logistics: Real-Time Tracking and Route Optimization
Shipments and vehicles in motion generate continuous location and condition data. Real-time analytics processes this stream alongside live traffic conditions, weather data, and delivery window constraints to surface optimization opportunities as they emerge.
Routes adjust dynamically in response to congestion or missed stops. The outcome is a delivery network that responds to real-world conditions as they develop, instead of the plan that existed when routes were first assigned.
6. SaaS and Digital Products: User Behavior Analytics
Product teams building software need to know how users interact with features as those interactions happen. Real-time analytics captures in-product behavior, session progression, and engagement patterns as events, routing them to product dashboards, support queues, and engagement automation workflows.
When a user hits a friction point, a drop-off pattern, or a milestone that signals upgrade readiness, a targeted intervention can be triggered within the same session. This capability supports retention and expansion motions without waiting for weekly cohort reports to surface what happened.
What these use cases share is a common dependency on pipeline latency and event-driven logic. The industry context changes, but the underlying architectural requirements remain consistent.
The question for most organizations is which use cases represent the highest cost of delay, and that gap is where real-time analytics investment typically starts.
Conclusion
Delayed dashboards and batch reports create conditions where reactive decision-making becomes the default operating posture. As data volumes grow and event cycles compress, the cost of acting on information that is hours old rises in proportion.
The next step is to assess which functions in your organization are still running on scheduled reporting, identify where live data is available but not being processed in time, and decide whether the current architecture can support the latency requirements of your highest-value use cases.
If you work with Cygnet.One, here is what that looks like in practice:
- Data architecture assessment to identify gaps in your current pipeline
- Pipeline design across ingestion, processing, and visualization layers
- Validated deployment against defined latency and throughput benchmarks
Every engagement is scoped around your team’s actual operational requirements rather than a generic blueprint. If your data infrastructure is overdue for a second look, book a demo with Cygnet.One today.
FAQs
Real-time analytics is the process of analyzing data as it is generated rather than waiting for it to accumulate in batches. It enables organizations to act on events within seconds or milliseconds, turning streaming data into immediate decisions rather than delayed reports
Batch processing collects data over a defined period and analyzes it in scheduled runs, producing insights with a lag of minutes to hours. Real-time analytics processes data continuously as it arrives, making it suitable for time-sensitive use cases where acting on stale information carries a measurable cost.
Streaming analytics handles the movement and transformation of data as it flows through a pipeline. Real-time analytics is the broader system that includes processing, analysis, and delivery of actionable outputs such as alerts, dashboards, and automated responses. Streaming analytics is a component that powers real-time analytics, not a synonym for it.
Financial services, healthcare, retail and e-commerce, manufacturing, and logistics are among the highest-adoption industries. Each applies real-time analytics for a distinct operational purpose: fraud detection, patient monitoring, in-session personalization, predictive maintenance, and dynamic route optimization.
Real-time data processing typically involves three categories of tooling: event brokers and message queues for ingestion, stream processing engines for computation, and in-memory or fast-access stores for low-latency retrieval. Specific platforms within each category vary by workload volume, latency requirements, and infrastructure constraints.
Implementation complexity depends on scale and latency requirements. The core challenge is aligning ingestion capacity, processing logic, and storage architecture to meet defined throughput and latency benchmarks without creating bottlenecks. For organizations without in-house streaming data expertise, working with an experienced implementation partner significantly reduces time to production.
Author


Abhishek Nandan
AVP, Marketing
Abhishek Nandan is the AVP of Services Marketing at Cygnet.One, where he drives global marketing strategy and execution. With nearly a decade of experience across growth hacking, digital, and performance marketing, he has built high-impact teams, delivered measurable pipeline growth, and strengthened partner ecosystems. Abhishek is known for his data-driven approach, deep expertise in marketing automation, and passion for mentoring the next generation of marketers.