


Most businesses today have more data than they know how to use. Transaction records accumulate in ERP systems, customer behavior flows into CRM platforms, operational metrics sit in spreadsheets, and web analytics generate thousands of data points daily. The data exists but the insight rarely follows automatically.
Data analytics for business is the structured practice of extracting meaning from that accumulated data and connecting it to the decisions that determine performance.
Organizations that do this well make faster calls, understand their customers at a level of granularity that competitors cannot match, and find operational improvements in places intuition would never identify.
Organizations that do not are effectively operating with expensive instruments that they rarely consult.
The gap between those two states is not primarily about technology. It is about strategy, data infrastructure, and the organizational commitment to use data as the starting point for consequential decisions rather than a reference point consulted after the fact.
This guide covers what data analytics for business involves, what it delivers, and how organizations build the capability to use it well.
What is Data Analytics for Business?
Data analytics for business is the practice of systematically collecting, processing, and analyzing organizational data to support decision-making and improve business outcomes.
It includes a broad set of methods, from statistical analysis of historical records to machine learning models that generate real-time predictions.
Businesses apply analytics across functions including finance, marketing, operations, and supply chain to identify patterns that manual analysis would miss and respond to those patterns with precision.
Organizations that embed analytics into their decision-making processes consistently improve performance across both operational and strategic dimensions.
Types of Data Analytics Used in Business
Data analytics exists on a spectrum from understanding what has already occurred, to diagnosing why it occurred, to forecasting what will occur next, to recommending what to do about it.
The four principal types operate as progressive layers of analytical capability, and the most analytically mature organizations deploy all four depending on the decision context and the urgency of the business question at hand.
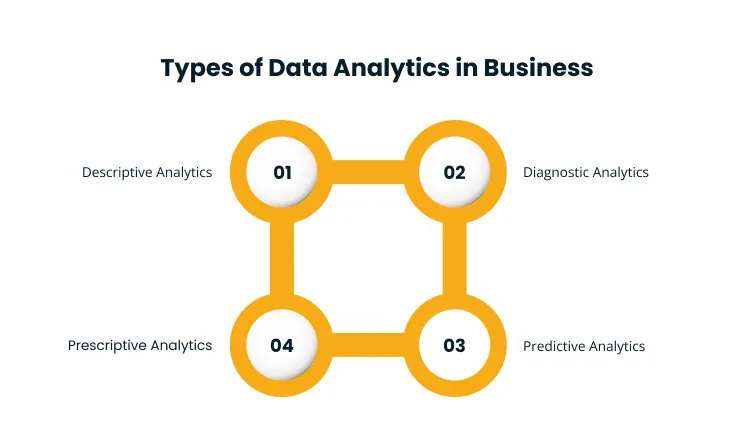
1. Descriptive Analytics
Descriptive analytics provides a structured view of historical performance using aggregated data from past operations. It is the foundation of business intelligence, powering the dashboards, reports, and summary metrics that give leaders a baseline understanding of where the organization stands.
Sales figures by territory, revenue trends by quarter, and customer churn rates by month are all outputs of descriptive analytics. It answers the question of what happened and delivers the operational visibility that enables every subsequent layer of analysis to be grounded in documented fact rather than assumption.
Without descriptive analytics, there is no agreed-upon starting point from which more advanced analysis can proceed.
2. Diagnostic Analytics
When descriptive analytics reveals an unexpected result, diagnostic analytics investigates the reason. It moves analysis from observation to explanation by comparing data sets, drilling into subgroups, and testing hypotheses against historical evidence.
If revenue declines in a specific region, diagnostic analytics traces the factors correlated with that decline, whether pricing changes, competitor activity, or shifts in customer behavior.
The difference between descriptive and diagnostic work is the difference between reading a business outcome and understanding the causal chain that produced it.
Organizations that invest only in descriptive capability are equipped to notice problems, but not to explain them with enough precision to act effectively.
3. Predictive Analytics
Predictive analytics uses statistical models and machine learning algorithms trained on historical data to generate probability-based forecasts of future outcomes. It allows businesses to move from reacting to events after they occur to positioning ahead of patterns that data signals are coming.
Common applications include:
- Demand forecasting for inventory management
- Churn prediction for customer retention programs, and
- Credit risk scoring for financial services.
The reliability of predictive models depends directly on the quality and completeness of the underlying data, which is why foundational data management practices determine how useful predictive analytics can be in practice.
4. Prescriptive Analytics
Prescriptive analytics extends the logic of predictive work by recommending specific actions in response to forecast outcomes.
It combines predictive models with optimization algorithms to evaluate possible courses of action, weigh their tradeoffs, and surface the option most likely to produce the desired result. A logistics company might use prescriptive analytics to determine the optimal delivery route under fluctuating demand conditions.
For example, a retailer might use it to identify the most effective promotional offer for a specific customer segment given predicted purchase likelihood. It is the highest-order application of data in business decision-making, translating data-derived foresight into a direct, executable recommendation.
Significance of Data Analytics in Business
Organizations that make analytical data part of their standard decision-making process outperform those that do not on virtually every metric that business leaders track, from customer retention to operating margins to speed of response.
The sections below examine where those performance differences appear and why they are structurally difficult to close without committing to analytics as an organizational practice.
1. Improved Decision-Making Accuracy
Data analytics replaces inference and intuition with evidence derived directly from organizational and market data. Leaders who rely on analytics are working from an objective account of what has happened and what is likely to happen next, rather than a subjective interpretation of incomplete information.
The financial impact of this shift is measurable and significant. According to the 2024 McKinsey State of AI Report, 42% of high-performing organizations say more than 20% of their EBIT is attributable to their use of nongenerative, analytical AI, reflecting how deeply data-driven decision-making shapes business outcomes for those who apply it rigorously.
Organizations that formalize analytical processes reduce the frequency of decisions made on faulty assumptions and shorten the time between identifying a problem and determining the right response.
2. Enhanced Customer Insights
Understanding customers at the level of behavior rather than assumption is one of the most direct competitive advantages analytics creates.
When businesses analyze purchase patterns, engagement histories, support interactions, and browsing sequences together, they build a picture of customer need that self-reported surveys rarely capture.
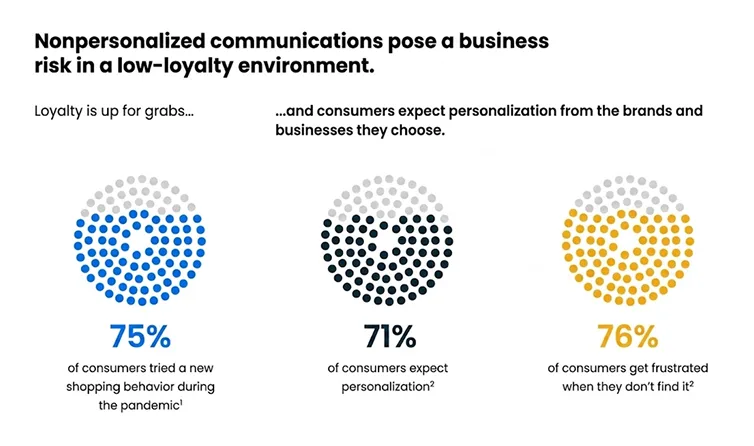
This depth of insight enables personalization at scale, the ability to deliver offers, content, and service interactions calibrated to individual preferences rather than broad demographic segments.
According to the 2021 The Next in Personalization Report by McKinsey, 71% of consumers expect companies to deliver personalized interactions, and 76% report frustration when those experiences are absent.
Organizations that lack customer analytics capability are actively creating friction at the point of customer engagement, with data they already hold sitting unused.
3. Increased Operational Efficiency
Inefficiency in business operations is frequently invisible without data. Manual workflows accumulate friction over time, redundant steps go unquestioned because they have always been there, and resource allocation decisions are made based on habit rather than demand.
Analytics makes inefficiency visible by tracing the actual flow of work across systems and identifying where time, cost, and effort are absorbed without proportionate output.
According to the 2025 McKinsey’s “State of AI: How Organizations are Rewiring to Capture Value” Report, 80% of organizations cite efficiency improvement as the primary objective when deploying analytics and AI initiatives, making operational gains the most consistently targeted outcome in enterprise data adoption.
Process analytics, resource utilization monitoring, and demand-driven workforce planning are among the direct applications that connect analytical insights to reduced operating costs.
4. Revenue Growth and Cost Optimization
Data analytics enables organizations to identify both where revenue opportunities exist and where costs are being generated without proportionate return.
On the revenue side, analytics surfaces high-value customer segments, underperforming product lines, and market conditions that indicate timing windows for expansion.
On the cost side, it reveals redundant vendor relationships, underutilized assets, and process steps that consume resources without contributing to output customers’ value.
The organizations that close both sides of this equation using analytics, growing revenue through insight while systematically reducing avoidable cost, gain a structural efficiency advantage over competitors whose resource allocation decisions remain disconnected from data.
How to Implement Data Analytics in Business?
Many organizations invest in tools before they have resolved the foundational questions of what they want analytics to do, where their data lives, and whether their teams are equipped to work analytically.
Addressing those questions in the right order is what separates analytics programs that deliver sustained value from those that produce expensive dashboards with limited organizational uptake.
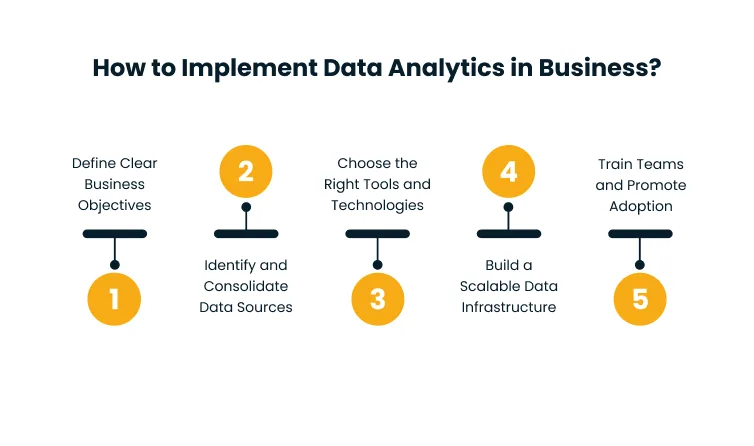
1. Define Clear Business Objectives
The single most common reason analytics initiatives lose momentum is that they are not anchored to a specific business problem.
When analytics is framed as a capability to build rather than a problem to solve, it attracts investment and attention early and loses both when early outputs do not connect visibly to business performance.
Effective implementation begins with a precise statement of what needs to change and how data will help change it. Consider the specificity required:
- Increasing customer retention among a defined segment with predictable churn behavior
- Reducing time to close in a specific sales process where pipeline data already exists
- Cutting inventory carrying costs in a product category with measurable demand variance
Objectives at this level of precision guide tool selection, data prioritization, and success measurement. Without that precision, every downstream decision becomes a matter of judgment rather than design.
2. Identify and Consolidate Data Sources
Most organizations have no shortage of data. However, the problem is that their data lives in disconnected systems, each owned by a different team, formatted differently, and updated on different schedules.
Before analytical tools can generate reliable outputs, the data those tools will query must be brought into a governed, consistent, and accessible environment. This means:
- Mapping all data-producing systems
- Identifying which data sets relate to the business objective,
and - Establishing a process for integrating and synchronizing those sources.
Cygnet.One’s Insights Driven Business Transformation service connects cloud platforms, legacy databases, and structured data sources into unified views, replacing manual data reconciliation with reliable, accessible data environments that analytics teams can build on without the overhead of constant data cleaning.
3. Choose the Right Tools and Technologies
Tool selection is consequential not because any single platform is universally better, but because the wrong tool creates friction at every stage of the analytics workflow.
Organizations with distributed teams and varied analytical sophistication need tools that can be deployed across role types, from executive dashboards to developer-facing data models.
Organizations with embedded use cases, such as analytics integrated directly into a CRM or ERP, need platforms that deliver insights at the point of workflow rather than in a separate reporting environment.
Cygnet.One’s Business Analytics and Embedded AI service delivers real-time dashboards and predictive analytics across Power BI, Tableau, and Looker, with embedded analytics designed to surface actionable insights directly inside the applications where teams already work, reducing the adoption friction that typically limits analytics ROI.
4. Build a Scalable Data Infrastructure
Analytics initiatives that succeed at initial scale often fail under the pressure of growing data volumes, new data sources, and increasing user demand.
The infrastructure decision, whether to build on cloud platforms, use a managed data warehouse, or deploy a hybrid architecture, determines whether the analytics environment can grow with the organization or requires a costly rebuild at each stage of expansion.
Cloud-based platforms such as Snowflake, Azure, and AWS provide flexible storage and compute models that scale with usage rather than requiring upfront capacity planning.
Building infrastructure with scaling in mind from the start avoids the most common cause of analytics program stagnation: a technically successful initial deployment that cannot sustain a growing organization’s demands.
5. Train Teams and Promote Adoption
Technology investment in analytics delivers value only where the people using it understand how to extract insights and are motivated to do so. An analytics platform adopted by a subset of the organization produces partial visibility and inconsistent decision-making.
Building analytical capability across teams requires structured training that moves beyond tool mechanics to data interpretation, insight communication, and analytical reasoning.
Organizations that treat adoption as a cultural challenge rather than a technical one focus on creating incentives for data-driven behavior, demonstrating early wins from initial analytical outputs, and building internal communities of practice that sustain engagement beyond the initial deployment phase.
Conclusion
The organizations that sustain analytics programs over time start with a specific problem, build the data infrastructure to address it, and then expand analytical scope as each layer of capability demonstrates its value.
The progression from descriptive to prescriptive is not linear in practice. It is iterative, and iteration requires a culture in which employees trust data, leaders model data-driven reasoning, and tools are close enough to existing workflows that reaching for data requires less effort than relying on intuition.
The distance between where most organizations are and where they need to be in analytics is a combination of infrastructure decisions, data quality commitments, and organizational alignment that no single tool purchase can resolve. The right approach begins with those decisions, not with the tools themselves.
Analytics programs that lack the right infrastructure and tooling rarely deliver their intended impact. Cygnet.One’s Business Analytics and Embedded AI service designs and deploys analytics environments that surface insight at the point of decision.
Book a demo to explore what a fully integrated analytics environment looks like for your organization.
FAQs
Data analytics for business is the process of systematically collecting, processing, and analyzing organizational data to identify patterns, generate insights, and improve decision-making. It spans four types of analysis from historical reporting to actionable prescriptions and is applied across functions including finance, marketing, operations, and customer experience to drive measurable performance improvements.
Data analytics replaces guesswork with evidence at every decision point. Organizations that embed analytics into core processes make faster and more accurate decisions, understand customer behavior with greater depth, identify operational inefficiencies that intuition would miss, and connect resource allocation choices to measurable business outcomes rather than historical assumptions or instinct.
The four types of data analytics are descriptive analytics, diagnostic analytics, predictive analytics, and prescriptive analytics. Most organizations begin with descriptive capability and progress toward predictive and prescriptive analysis as data infrastructure matures.
Analytics improves decisions by replacing inference with evidence derived from actual organizational and market data. Leaders working from analytical insights have a documented account of what has happened and a probability-based view of what is likely to happen next, reducing reliance on assumptions and shortening the time between identifying a problem and determining the right response.
Business intelligence platforms such as Power BI, Tableau, and Looker handle reporting and visualization. Cloud data platforms including Snowflake, Azure, and AWS provide the storage and compute infrastructure that analytics environments require. Machine learning frameworks and embedded analytics solutions extend capability into predictive and prescriptive applications, enabling organizations to deploy insights at the point of decision.
Yes. Analytics tools are available across a range of scales and price points, and the foundational principles, defining clear objectives, consolidating data sources, and measuring outcomes, apply regardless of organization size. Even basic descriptive analytics applied to sales performance, customer behavior, or operational metrics can produce actionable insights for organizations with modest data infrastructure.
Author


Abhishek Nandan
AVP, Marketing
Abhishek Nandan is the AVP of Services Marketing at Cygnet.One, where he drives global marketing strategy and execution. With nearly a decade of experience across growth hacking, digital, and performance marketing, he has built high-impact teams, delivered measurable pipeline growth, and strengthened partner ecosystems. Abhishek is known for his data-driven approach, deep expertise in marketing automation, and passion for mentoring the next generation of marketers.