


Most enterprises now sit on warehouses of data that cost millions to build and produce a fraction of the business outcomes the original case promised. The dashboards exist, the cloud bill arrives every month, and executives are still asking what their data is actually deciding for them.
Data analytics use cases exist to close that gap between data infrastructure and operational impact. Each use case is a specific application of analysis to a real business problem, with measurable outcomes that justify the spend.
In 2026, the leadership conversation has shifted from whether to invest in analytics to which use cases will produce returns inside a single quarter. Tighter budgets have pushed experiments without a clear payback path off the roadmap, leaving room only for applications that convert data into decisions the business can act on.
Top data analytics use cases in 2026
According to the 2026 Gartner Study on Data and Analytics Foundations for AI, organizations with successful AI initiatives invest up to four times more in their data and analytics foundations than those whose initiatives stall, which is what funds the use cases that ultimately earn the roadmap.
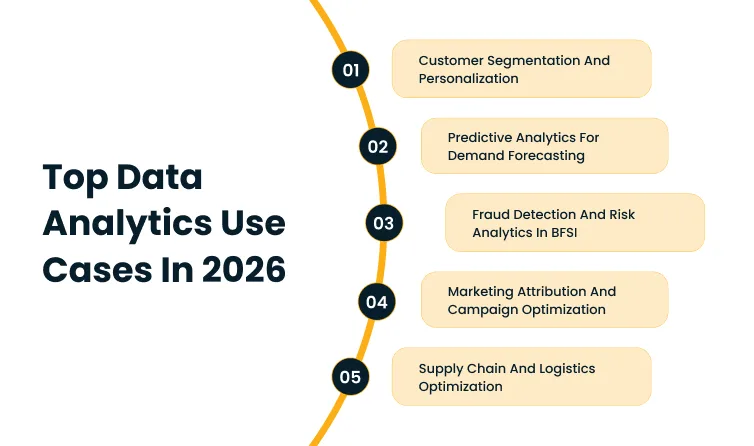
1. Customer segmentation and personalization
Modern analytics groups customers by behavior, purchase frequency, channel preference, lifetime value, and propensity to churn, which produces clusters that map to specific actions sales and marketing teams can take.
A high-value customer trending toward churn gets a retention motion. A first-time buyer with strong second-purchase signals gets an upsell sequence. A long-dormant account gets a reactivation email instead of a generic newsletter.
Personalization runs on top of that segmentation. Recommendation engines, dynamic pricing, tailored landing pages, and triggered email sequences each draw from the same underlying models to deliver an experience that maps to the individual rather than the demographic.
The lift on conversion rates and average order values is large enough that retailers, banks, and B2B SaaS companies build dedicated teams around it.
The deployment pattern is also forgiving. A first model can ship in eight to twelve weeks against existing CRM and transaction data, which keeps the ROI window short enough to justify follow-on investment.
2. Predictive analytics for demand forecasting
Demand forecasting was historically a planning exercise built on twelve-month lagging averages and a lot of expert judgment.
Predictive analytics replaces both with models that process historical sales, seasonality, promotional calendars, weather, macroeconomic indicators, and supplier lead times in parallel.
The output is a forecast at the SKU and location level that operations and finance teams can plan against without rebuilding it every quarter.
The business outcome shows up in three places. Inventory holding costs drop because safety stock can be calibrated to actual demand variance instead of a flat assumption.
Stockouts fall because the forecast catches demand spikes early enough for procurement to react. Manufacturing throughput improves because production schedules align with predicted volume rather than a static plan.
Retail and consumer goods companies see the clearest gains, but the model architecture transfers well to manufacturing, distribution, and any business where holding cost and stockout cost both run high.
Cygnet.one’s Business Analytics and Embedded AI service builds these forecasting models directly into ERP and supply chain platforms, so the output lands in the systems planners already use rather than as a separate dashboard they have to reconcile.
3. Fraud detection and risk analytics in BFSI
BFSI was one of the first industries to operationalize analytics at scale, largely because the cost of a missed fraud signal lands directly on the income statement.
Modern fraud detection systems run real-time scoring on every transaction, looking for anomalies in amount, location, merchant category, device fingerprint, and timing that deviate from the customer’s established pattern.
A flagged transaction either holds for verification or routes for manual review, and the false-positive rate matters as much as the true-positive rate because a frustrated customer abandons a card just as fast as a victim of fraud does.
Risk analytics extends the same modeling approach into credit decisioning, anti-money-laundering screening, and operational risk monitoring. The financial stakes make the business case obvious.
According to the 2025 IBM Cost of a Data Breach Report, the global average cost of a data breach reached USD 4.44 million in 2025, with organizations facing significant security skills shortages paying USD 5.74 million on average compared to USD 3.98 million for those with stronger security teams.
Banks and insurers that build fraud and risk analytics into their core platforms reduce both the exposure and the cleanup cost when an event does occur.
Cygnet.one’s Insights Driven Business Transformation practice supports financial services clients with the modeling, integration, and governance work that turns transactional data into real-time risk decisions across the customer lifecycle.
4. Marketing attribution and campaign optimization
Marketing attribution has always been hard, and the death of third-party cookies has not made it easier.
Most enterprise marketing teams now run multi-touch attribution models that credit conversions across the full customer journey, weighted by the contribution of each touchpoint rather than crediting the last click alone.
The output tells the budget owner which channels actually drive revenue, which channels look productive only because they sit at the bottom of the funnel, and where additional spend will produce the highest marginal return.
Campaign optimization runs as a continuous feedback loop on top of the attribution layer. Bid strategies, creative variants, audience segments, and channel mix update in near real time as new conversion data arrives.
The shift in spend allocation is often dramatic. Channels that absorbed 30 to 40% of the budget under last-click attribution can drop to 10% or less when a fair-share model exposes their actual contribution, which frees budget for the channels that move the funnel earlier.
The deployment pattern works for any company running paid acquisition at scale, including B2B SaaS, financial services, retail, and direct-to-consumer brands.
5. Supply chain and logistics optimization
Supply chain analytics gives operations teams real-time visibility into a network that historically reported in weekly or monthly batches.
Telematics data from carriers, IoT signals from warehouses, ERP transactions, and supplier scorecards feed a unified view of inventory in motion, dwell times at nodes, and the probability of late delivery on any open order.
When a disruption appears, whether a port closure, a weather event, or a supplier outage, the system surfaces the affected orders, ranks them by customer and revenue impact, and recommends rerouting or substitution before the disruption hits the customer.
Logistics optimization adds prescriptive layers on top of the visibility. Route optimization reduces fuel and labor costs across last-mile fleets.
Network design models continuously rebalance inventory across warehouses so high-velocity SKUs sit closer to the demand.
Dynamic warehousing decisions, like which orders to expedite and which to consolidate, now happen automatically inside warehouse management systems rather than as a manual override.
The downstream effect on working capital is meaningful because inventory holding costs and expedited freight costs are both squeezed without trading off service levels.
Cygnet.one’s Hyperautomation practice integrates these analytics layers into the SAP, Oracle, and warehouse management systems already running the supply chain, so the recommendations execute inside the workflow rather than as a separate dashboard.
How to identify top data analytics use cases
A list of top use cases is useful as a reference, but every enterprise has constraints that change which use cases pay back first.
The data may be more accessible in one domain than another. The business case may be stronger in BFSI than HR, or stronger in HR than BFSI, depending on the company.
The right approach is to apply a structured framework that filters use cases through the organization’s specific data, talent, and business priorities, then act on what survives the filter.
Step-by-step framework
Each step below has a specific output that feeds the next, which keeps the process disciplined when stakeholders inevitably try to skip ahead to model selection.
- Define clear business objectives:
Start with a measurable problem the business already pays attention to, like reducing customer churn by two percentage points or improving demand forecast accuracy by 15%.
Use cases that cannot be tied to a leadership-level metric tend to lose budget the first time priorities shift.
- Identify and assess available data sources:
Inventory the internal systems, third-party feeds, and event streams that hold the data the use case will need. Score each on quality, accessibility, latency, and governance maturity.
Many promising use cases die at this step because the underlying data is more fragmented than the original sponsor assumed.
- Map use cases to analytics types:
Match the problem to the right analytical approach. Descriptive reporting answers what happened, diagnostic answers why, predictive answers what will happen, and prescriptive recommends what to do about it.
The mismatch most often surfaces as a leadership team asking for prediction when the data only supports description.
- Evaluate feasibility and ROI potential:
Score each candidate on technical complexity, resource requirements, time to first production deployment, and expected business impact.
The output is a two-axis grid that exposes which use cases are realistic in the next two quarters and which require infrastructure work to even reach a pilot.
- Prioritize use cases based on impact vs effort:
Use the grid to surface the high-impact, low-effort candidates first. Early wins build credibility and budget for the higher-ambition use cases later in the roadmap.
Skipping this step is how organizations end up with a flagship analytics program that delivers nothing measurable for 18 months.
- Build a pilot and validate outcomes:
Run a constrained pilot against real data and a defined success metric, then measure outcomes against the original business objective from step one.
A pilot that meets the metric scales. A pilot that misses gets cut, redirected, or fixed before further investment.
This kind of structured filtering is where external help adds the most value early in an analytics program.
Cygnet.one’s Insights Driven Business Transformation runs the use case identification, prioritization, and pilot design steps as a packaged engagement, with templates and scoring rubrics that compress what is often a four-month internal exercise into a structured six-week sprint.
Common mistakes to avoid
The five mistakes below show up across industries and organization sizes. Each one is preventable with the right discipline at the start of the program, and each one is expensive to undo once the program is in flight.
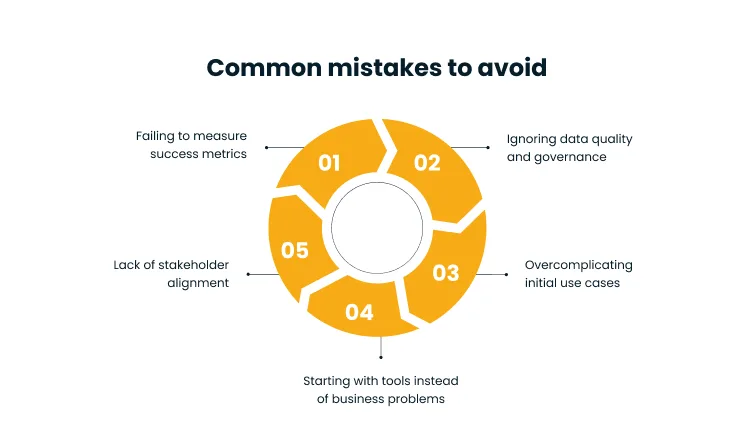
1. Starting with tools instead of business problems:
The pattern looks like a procurement decision on a BI platform, data science notebook, or feature store before any use case has been scoped.
Tools picked this way tend to become shelfware because the use case eventually surfaces in a different shape than the tool was selected for.
2. Ignoring data quality and governance:
Models built on inconsistent, late, or poorly governed data produce inconsistent, late, or poorly governed predictions.
According to the 2025 Gartner Survey on Data Management Practices for AI, organizations will abandon 60% of AI projects through 2026 because of the lack of AI-ready data.
Analytics use cases face the same gravitational pull, which is why data quality and governance work belongs in the program plan from week one rather than as a remediation step after the first pilot underperforms.
3. Overcomplicating initial use cases:
Teams that try to solve advanced prescriptive problems on day one tend to underestimate how much foundational work the data, the platform, and the operating model require.
Starting with a focused descriptive or predictive use case builds the muscle the organization needs before tackling the harder ones.
4. Lack of stakeholder alignment:
A model that no one in the business commits to using is an expensive academic exercise.
Alignment fails most often when the analytics team is staffed in isolation from the function that will own the outcome, or when the function lacks the analytical talent to evaluate whether the model fits the workflow.
According to the 2026 Gartner CFO Survey on AI and Digital Talent, acquiring and developing AI and digital talent is the top near-term challenge cited by CFOs, which is one reason analytics programs without paired business owners stall before they reach production.
5. Failing to measure success metrics:
Programs that launch without baseline numbers, target metrics, and a measurement cadence produce no signal on what is working.
The downstream effect is that successful use cases do not get scaled because no one can prove the lift, and unsuccessful ones do not get cut because no one can prove the loss.
KPI design belongs in the use case scoping document, not in a follow-up workstream.
Conclusion
The enterprises that get the most out of analytics treat it as a portfolio of bets rather than a single transformation program. The portfolio is rebalanced every two or three quarters as use cases mature, deliver, or sunset.
What remains constant is the discipline of tying every use case to a business outcome the leadership team already cares about, and the willingness to kill ones that do not pay back inside the window the original business case promised.
The use cases that earn the roadmap in 2026 are not necessarily the most technically ambitious ones. They are the ones with the cleanest line of sight from data to decision, the strongest internal owner, and the lowest organizational drag between the model output and the action the business takes on it.
Identifying the right analytics use cases shapes whether data investment compounds or stalls in the dashboard layer.
Cygnet.one’s Data Analytics & AI practice covers use case identification, modeling, and embedded deployment across BFSI, healthcare, retail, and manufacturing. Book a demo to scope which use cases will produce measurable returns inside your next planning cycle.
FAQs
The most common data analytics use cases are customer segmentation and personalization, predictive demand forecasting, fraud detection and risk analytics in BFSI, marketing attribution and campaign optimization, and supply chain and logistics optimization.
The companies that choose well start with a business problem the leadership team already cares about, then assess data availability, score feasibility against ROI potential, and prioritize on an impact-versus-effort grid. The shortlist that survives the filter feeds into a pilot designed against a measurable success metric, which validates the use case before further investment.
BFSI, healthcare, retail, manufacturing, logistics, and marketing functions across industries see the strongest returns. Each operates with high transaction volumes, complex decision flows, and regulatory or competitive pressure that rewards analytical precision. Healthcare analytics in particular is gaining ground around population health, claims integrity, and clinical decision support.
Most enterprise programs combine a data warehouse or lakehouse, a BI platform for descriptive analytics, a machine learning platform for predictive and prescriptive modeling, and an integration layer that surfaces outputs inside the systems business users already work in. The right combination depends on the use cases the program is targeting, not the other way around.
A focused descriptive or predictive use case can deliver a first production model in eight to twelve weeks against clean, accessible data. More complex prescriptive use cases, or use cases that require data engineering work upfront, can take three to six months or longer. The implementation timeline tracks closely with how AI-ready the underlying data is on day one.
Author


Abhishek Nandan
AVP, Marketing
Abhishek Nandan is the AVP of Services Marketing at Cygnet.One, where he drives global marketing strategy and execution. With nearly a decade of experience across growth hacking, digital, and performance marketing, he has built high-impact teams, delivered measurable pipeline growth, and strengthened partner ecosystems. Abhishek is known for his data-driven approach, deep expertise in marketing automation, and passion for mentoring the next generation of marketers.