


Most organizations today are not short on data, tools, or investment. What they are short on is reliable, decision-ready insight.
Despite years of building data platforms, adopting BI tools, and moving to the cloud, teams still struggle with the same core data analytics challenges, such as poor data quality, delayed reporting, inconsistent metrics, and limited alignment with business goals.
The problem is that modern analytics environments have become inherently complex. Data is generated across dozens of systems, tools have multiplied across teams, and ownership of metrics is often fragmented. As a result, even simple questions can take too long to answer, and critical decisions are made on incomplete or conflicting information.
This is why data analytics remains difficult for most enterprise teams. The challenges are often interconnected problems rooted in how data is captured, managed, and used across the organization. Fixing them requires addressing the underlying gaps in data quality, integration, governance, and alignment.
In this blog, we break down the most common data analytics challenges organizations face today, explore why they persist, and outline practical ways to solve them so analytics can move from a reporting function to a reliable engine for decision-making.
Why Data Analytics Is Still Difficult for Most Teams
Data analytics challenges arise when organizations struggle to turn raw data into accurate, timely, and actionable insights. Common issues include:
- Poor data quality
- Reporting delays
- Inconsistent metrics, and
- A lack of alignment with business goals.
The challenge persists for three structural reasons that reinforce each other rather than offset.
- Data volumes keep outpacing infrastructure: The volume, velocity, and variety of data flowing through enterprise systems have grown faster than the platforms, pipelines, and governance models built to handle it.
- The tool landscape has fragmented: Analytics data now lives across dozens of SaaS platforms, data warehouses, spreadsheets, and legacy systems, with integration often treated as an afterthought.
- Business and data teams are misaligned: Different priorities, metric definitions, and incentives leave analytics work disconnected from the questions that actually matter to leadership.
According to Gartner’s 2024 forecast on worldwide public cloud end-user spending, public cloud spending was projected to reach USD 723 billion in 2025, up 21.5% year over year. The investment is scaling up, but it is scaling up in fragmented directions, which is why the analytics environment keeps getting more complex rather than more manageable.
10 Common Data Analytics Challenges (and How to Solve Them)
The challenges below show up repeatedly across the enterprise analytics environments. Most are not isolated issues, and fixing any one of them without addressing the root causes feeding it tends to produce temporary relief rather than lasting change.
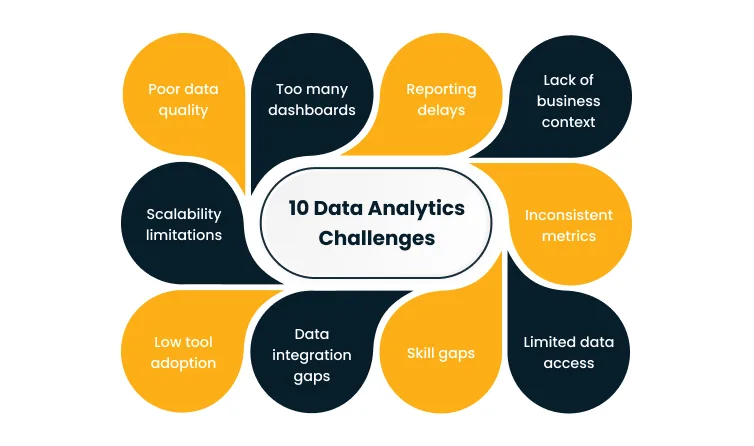
1. Poor data quality
Analytics outputs drift from reality when the underlying data is inaccurate, duplicated, or missing in the places that matter most. Reports start to contradict each other, KPIs shift every time someone re-runs a query, and confidence in the numbers quietly erodes across the business.
The root cause usually sits upstream, where source systems capture data inconsistently across teams and geographies, validation rules are weak or absent at the point of entry, and data moves through multiple transformation layers where errors accumulate without clear ownership of end-to-end quality.
Left alone, this compounds into misallocated budget, missed customer signals, and strategic decisions grounded in numbers that no longer reflect the actual state of the business.
The fix is to treat quality as continuous work rather than a periodic cleanup project, which means embedding data cleaning and deduplication into ingestion pipelines, enforcing validation rules on every critical field at the source, and standing up continuous monitoring with alerting so teams catch drift before it reaches reports.
2. Too many dashboards
Dashboards tend to multiply until no one is sure which one is authoritative. The same KPI shows up in five places with three different values, and users default to whichever dashboard loads fastest or was shared most recently.
The pattern emerges because every team builds its own reports for its own context and nothing ever retires, so reporting gets treated as the goal rather than the means and tool sprawl grows with no consolidation pressure.
Over time, decision makers lose confidence in any single dashboard, stop using them altogether, and fall back on intuition or ad-hoc requests that overload the analytics team further.
Solving this starts with consolidation. Replace the long tail of reports with KPI-driven dashboards tied to specific decisions, audit existing assets against active usage and retire the redundant ones, and enforce a standard where a new dashboard only gets created when an existing one genuinely cannot be extended.
3. Reporting delays
Reports that arrive hours or days after the business needed them are one of the most visible analytics problems. Monthly cycles stretch past the first week of the following month, and operational decisions get made with last week’s view of the world because this week’s numbers are still in flight.
The usual causes are batch processing schedules built for a different scale, manual stitching across systems that never got integrated, and hand-offs between analysts, engineers, and business teams that layer review cycles on top of the actual processing time.
Delays of this kind translate directly into lost opportunity cost, whether that shows up as marketing spending on channels that have already saturated, inventory sitting because stockout signals arrived too late, or finance closing the books on assumptions rather than actuals.
Closing the gap means moving high-value reporting workloads onto streaming or near-real-time architectures, automating data movement and transformation where manual steps still live, and redesigning the analytics request process so simple queries get answered in hours and strategic ones in days rather than the reverse.
4. Lack of business context
Metrics often arrive without the context needed to act on them. A dashboard shows revenue down 4% this quarter, but no one looking at it can tell whether that is driven by seasonality, a product issue, or a pricing change the team made last month.
This happens because analytics infrastructure prioritizes data movement over meaning, and there is no formal business layer defining what a metric means, who owns it, or what decision it is supposed to influence.
The result is that data gets misinterpreted, sometimes innocently and sometimes in ways that justify preconceived conclusions, and teams end up arguing about whose numbers are right rather than debating what those numbers actually imply.
A durable fix involves building a semantic layer that defines metrics once and reuses them across every tool and report, assigning each KPI a business owner accountable for its definition and interpretation, and pairing raw metrics with consistent context, such as time frame, segment, and comparison baseline, so readers draw the right conclusions.
5. Inconsistent metrics
The same metric often produces different values in different tools. Finance’s revenue number does not match sales’s revenue number, and both disagree with what the data warehouse reports, so meetings devolve into arguments about whose source is correct before any real decision gets made.
Inconsistency usually arises because every team defines the metric on its own, often without knowing that another team has already defined it differently, and the tool-level business logic duplicates and drifts over time.
Conflicting insights of this kind erode trust in analytics as a function, waste leadership time on reconciliation, and delay strategic bets because no one is sure which version of the numbers to rely on.
The way out is to establish a single source of truth through metric standardization and centralized definitions, implement data governance that assigns ownership for each critical metric and routes changes through a review process, and push the standardized definitions into the tools where teams actually work rather than forcing them to query a central system.
6. Limited data access
Analysts and business users often cannot get to the data they need without filing a ticket and waiting days for an engineer to run a query or grant access to a new dataset. Analytics becomes a bottleneck rather than a capability, and the speed of decision-making suffers as a result.
Most of the friction traces back to historical access controls built to protect data rather than enable it, tool limitations that restrict who can query which tables, and security or compliance layers designed for a smaller, more centralized data environment that have not evolved with the modern stack.
The practical consequences show up quickly. Work queues up behind the data engineering team, business users route around the system by exporting data to spreadsheets (which reintroduces quality and security problems), and decision speed slows because the people closest to the question cannot see the data.
The modern solution is to stand up self-service analytics capability backed by controlled access rather than manual approval, implement role-based access controls so business users can query what they need while being protected from what they should not see, and build data catalogs so users can find what exists without asking the engineering team first.
7. Skill gaps
Business teams often have access to analytics tools but lack the training to use them effectively, while analysts are stretched thin and the queue of analytics requests grows faster than the team can work through it.
The underlying dynamic is that analytics skills have evolved faster than most enterprises have upskilled their workforce, and tool complexity has increased in parallel, with modern stacks requiring knowledge of SQL, Python, modeling frameworks, and BI platforms that few business users have built.
When the capability gap persists, data assets get underused because the people who could benefit from them do not know how, and analytics teams end up operating as internal consultants delivering one-off answers rather than scaling analytics capability across the enterprise.
Closing the gap calls for a combination of targeted training programs and more intuitive self-service tools designed for business users rather than engineers, a cross-functional treatment of data literacy rather than a specialized one, and a shift in how the analytics team spends its time, with the focus moving toward reusable data products rather than answering each question individually.
According to Gartner’s 2026 CFO survey on AI and digital talent, acquiring and developing AI and digital talent is the top near-term challenge cited by CFOs. The shortage shows up directly inside analytics functions, where demand for modern skills is outrunning supply.
8. Data integration gaps
Critical data often sits in disconnected systems across the enterprise. Customer data lives in CRM, financial data in ERP, product usage data in separate telemetry pipelines, and none of it joins cleanly for the questions that cut across functions.
The gap emerges because SaaS purchases happen at the departmental level without an integration strategy, acquisitions bring in new systems that never get consolidated, and integration work gets deprioritized against feature delivery because its value is harder to quantify up front.
The downstream effects are significant. Insights are incomplete by construction, Customer 360 initiatives stall, analytics teams spend most of their time on data wrangling rather than analysis, and AI and advanced analytics initiatives underdeliver because the training data cannot be assembled.
Resolving this requires a unified data layer such as a data lake, lakehouse, or federated access platform that consolidates operational data with consistent quality standards, alongside integration pipelines and ETL/ELT tools that move data reliably between source systems and the analytics environment.
Cygnet.One’s Data Engineering and Management service helps enterprises consolidate fragmented data environments into integrated analytics platforms with the pipeline development, governance frameworks, and quality monitoring needed to make downstream analytics viable at scale.
9. Low tool adoption
Analytics tools that the enterprise invested in often go underused. Seat licenses go unclaimed, dashboards built by the central team get minimal traffic, and the self-service capability that was the original justification for the platform never materializes.
Adoption tends to fail when tools are too complex for the average business user, onboarding is weak, and trust in the underlying data is low enough that users default to asking for custom reports rather than querying the platform themselves.
Poor adoption drives weak return on analytics investment, keeps the business asking for more tools while failing to get value from the ones it already owns, and leaves central analytics teams overloaded because the self-service model never takes hold.
Turning this around calls for simplifying tool interfaces wherever possible and choosing platforms built for business users rather than only for engineers, investing visibly in data quality and governance so users can see that what they query is reliable, and pairing adoption programs with concrete, high-value use cases so users experience tangible benefit early.
10. Scalability limitations
Analytics systems that performed well at the previous data volume often struggle as the business grows. Query times stretch, reports fail under load, and the analytics team spends increasing effort on capacity firefighting rather than on new capability.
The root cause is usually legacy infrastructure designed for yesterday’s data volumes, access patterns, and concurrency requirements, and on-premise data warehouses built for batch reporting cannot keep pace with modern workloads that combine real-time streaming, ad-hoc exploration, and ML feature engineering.
The performance degradation flows through to every user and every process downstream, new initiatives get blocked because the platform cannot absorb additional load, and analytics starts to act as a constraint on business growth rather than an enabler of it.
The way forward is to migrate to cloud-based analytics architectures that scale elastically with demand, adopt modern data platforms such as warehouses, lakehouses, and stream processors designed for distributed scale from day one, and redesign the architecture around the access patterns the business actually needs rather than forcing new workloads into an older model.
According to Gartner’s 2025 research on AI-ready data, 60% of AI projects are expected to be abandoned by 2026 if organizations fail to build AI-ready data infrastructure. The scalability and quality of the analytics foundation now directly determines whether advanced use cases ever reach production.
Cygnet.One’s Cloud for AI-First practice helps enterprises build the scalable cloud foundations needed to run real-time analytics, AI workloads, and modern data platforms without hitting the infrastructure ceilings that block legacy environments.
What Should You Do Next to Overcome These Analytics Challenges
Most analytics problems are solved by building the underlying capability that makes analytics reliable, accessible, and tied to how the business actually makes decisions.
The practical steps we recommend for any enterprise working through these challenges include:
- Improve data quality at the source: Treat quality as a continuous program with validation, monitoring, and ownership, not a quarterly cleanup project.
- Align analytics with business goals: Every analytics initiative should trace to a specific decision or outcome the business is trying to influence.
- Invest in integration and unified data platforms: Fragmented data infrastructure is the root cause of most downstream analytics pain, and consolidation compounds in value over time.
- Enable self-service analytics: Give business users controlled access to the data and tools they need, so the central analytics team can focus on higher-value work.
- Modernize the underlying infrastructure: Cloud-based analytics platforms scale with demand and support the real-time and AI workloads that on-premise architectures cannot.
Enterprises that move decisively on these fronts find that analytics shifts from a reporting function with reliability problems to a decision-making engine that leaders trust and use.
As an analytics and data partner, Cygnet.One helps enterprises close the gap between data availability and actual insight generation. Our Data Engineering and Management practice consolidates fragmented data environments and builds the pipelines, governance, and quality monitoring that make analytics reliable at scale.
Our Cloud for AI-First practice provides the scalable cloud foundations needed for real-time and AI-ready analytics. And our AWS partnership supports cloud-based analytics infrastructure and migration for enterprises standardizing on AWS.
If your teams are working through any of the analytics challenges above and want a partner to help build the strategy and execution path forward, Book a demo to discuss how Cygnet.One can support your analytics and data modernization roadmap.
FAQs
The biggest data analytics challenges include poor data quality, too many redundant dashboards, reporting delays, lack of business context around metrics, inconsistent metrics across teams, limited data access, skill gaps, data integration gaps, low tool adoption, and scalability limitations.
Getting insights from data is hard because collection, reporting, and analysis each introduce their own friction. Data quality issues distort the inputs, fragmented tools and systems prevent joined-up analysis, inconsistent metric definitions cause conflicting outputs, and a lack of shared business context leaves even technically correct numbers open to misinterpretation.
Businesses improve data analytics by investing in data quality at the source, standardizing metric definitions and governance, consolidating fragmented data into integrated platforms, enabling self-service analytics for business users, and modernizing underlying infrastructure to scale with demand. The highest-leverage improvements come from fixing the foundations rather than buying additional tools.
Reporting delays are usually caused by a mix of batch processing schedules that do not match the speed of the business, manual workflows stitching data across systems, and hand-offs between analysts, engineers, and business teams that add review cycles on top of the processing time. Solving them requires automation, real-time or streaming architectures for the workloads that need them, and process redesign to cut unnecessary hand-offs.
The tools that help most are modern cloud data platforms such as warehouses, lakehouses, and streaming platforms, data integration and pipeline tools for ETL and ELT, data quality and observability tools, metric layers and semantic models, and self-service BI platforms built for business users.
Data governance is important in analytics because it is the mechanism that keeps metrics consistent, definitions stable, and access appropriate across the enterprise. Without governance, every team invents its own version of the truth, audit and compliance requirements get handled reactively, and trust in the data erodes. Governance turns analytics from a collection of isolated reports into a reliable decision-making capability.
Author


Abhishek Nandan
AVP, Marketing
Abhishek Nandan is the AVP of Services Marketing at Cygnet.One, where he drives global marketing strategy and execution. With nearly a decade of experience across growth hacking, digital, and performance marketing, he has built high-impact teams, delivered measurable pipeline growth, and strengthened partner ecosystems. Abhishek is known for his data-driven approach, deep expertise in marketing automation, and passion for mentoring the next generation of marketers.