


Data dashboard growth has accelerated across enterprise analytics environments. The challenge is that management practices have not kept pace. As more teams adopt business intelligence tools, dashboards multiply across departments and platforms. And while access increases, clarity tends to decline.
This is already evident across enterprises, with studies showing that 40% of data managers struggle daily with too many tools and data sources. Fragmented reporting environments are a direct consequence of weak data governance. At the same time, organizations still continue to invest in dashboards as a primary decision-making layer.
A 2025 survey of SaaS leaders found that while 78% of companies actively use dashboards, user satisfaction remains low at just 3.6 out of 5.
A significant portion of users, as a result, abandon dashboards entirely and revert to spreadsheets. That shift is where dashboard sprawl begins to affect decision-making at the organizational level.
What is data dashboard sprawl?
Dashboard sprawl refers to the uncontrolled growth of dashboards and analytics views across an organization using data analytics services. It takes hold when dashboards are created continuously, while older ones remain active, unreviewed, and without clear ownership.
The accumulation is gradual. Teams respond to business requests, analysts build what is asked of them, and the reporting environment quietly becomes harder to navigate. By the time the problem is recognized, duplication is already embedded in how the organization works.
Several patterns tend to emerge at this stage:
- Multiple dashboards serve similar purposes
- Users struggle to identify the most reliable report
- Metrics are calculated differently across dashboards
- Many dashboards receive little to no usage
These are not isolated symptoms. Taken together, they indicate a structural gap in how dashboards are governed and maintained across teams — which raises the more important question of why this happens in the first place.
Why dashboard sprawl happens in enterprises
The root cause is usually a lack of accountability without accessibility. Business intelligence tools have made dashboard creation fast and self-service, which is valuable — until there is no corresponding process for review, consolidation, or retirement.
Lack of ownership across dashboards
Dashboards are frequently created by individuals who move on to other priorities shortly after. Without a handoff or a designated owner, no one is responsible for ensuring that a dashboard remains accurate and relevant. Over time, reports accumulate across the environment with no active steward behind them.
Ad hoc dashboard creation culture
In many organizations, a new data request defaults to a new dashboard. Searching for an existing report that might already address the need rarely happens under time pressure. This pattern, repeated across teams, is one of the primary drivers of duplication at scale.
Fragmented BI environments
Enterprises frequently operate multiple BI platforms across business units — finance on one tool and marketing on another. Without centralized visibility across these platforms, overlapping reports are difficult to identify and even harder to consolidate.
Absence of BI governance frameworks
Without BI governance, there are no defined standards for creating or reviewing dashboards. Hence, dashboard creation becomes a default response to any analytical request. Ultimately, the environment grows without any structural limits.
As each of these factors compounds, the organizational cost of dashboard sprawl becomes increasingly difficult to ignore.
What is the cost of a dashboard sprawl?
The impact of dashboard sprawl shows in day-to-day operations well before it appears on any cost report.
Reduced productivity across analytics teams
A disproportionate share of analytics capacity gets absorbed by maintenance — reconciling numbers across reports, updating dashboards after metric changes, and responding to questions about why two reports show different values for the same KPI. The time cost is real, and it compounds as the dashboard count grows.
Loss of trust in business reporting
When different dashboards present conflicting values for the same metric, confidence in the data erodes. And once it does, it is difficult to rebuild. As a result, decision-makers start second-guessing reports, and analytical work that should inform strategy gets caught up in debates about data accuracy.
“20 people could run a report 20 different ways and come up with 20 different numbers.”
This is a governance failure, which manifests as a data quality problem in practice.
Higher infrastructure and licensing costs
Every dashboard consumes resources regardless of whether it is actively used. Storage, compute, and licensing costs scale with the number of assets under management. Across a large enterprise, the overhead associated with dormant dashboards represents significant spend with no corresponding return.
Impact of dashboard sprawl across business functions
| Area | Impact |
| BI Teams | Increased time spent on maintenance |
| Business Users | Difficulty finding accurate insights |
| Leadership | Slower and less confident decisions |
| IT Costs | Higher infrastructure and licensing expenses |
These consequences span the organization. That breadth is precisely why addressing dashboard sprawl requires a structured, cross-functional response rather than a localized fix.
How to reduce dashboard sprawl in business intelligence platforms
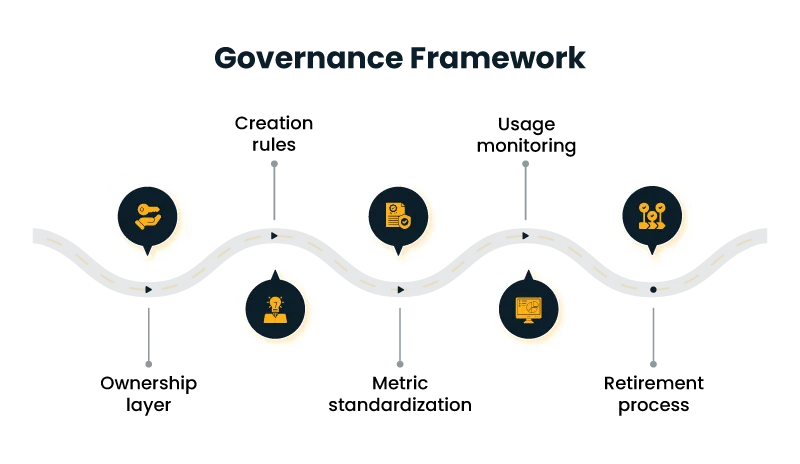
1. Establish clear ownership and accountability
Assigning a named owner to every dashboard is the foundational step. Ownership creates accountability for accuracy, relevance, and timely updates. Without it, governance policies and retirement processes remain theoretical, and there is no mechanism to enforce them at the asset level.
When ownership is embedded into how dashboards are managed, reports are treated as active, maintained assets rather than static outputs that persist indefinitely.
2. Implement structured BI governance policies
BI governance establishes the operational rules that keep dashboard environments manageable over time. This includes defining who is authorized to create dashboards, what approval process applies, and at what intervals reviews should occur.
In fact, studies show that organizations with strong data governance frameworks outperform their peers financially by an average of 20%. This shows the direct impact of structured BI governance on business outcomes.
3. Build a centralized dashboard discovery layer
A significant share of duplicate dashboards exists because analysts had no easy way to find out whether a comparable report already existed. A centralized discovery layer — a searchable, curated catalog of all dashboards across the BI environment — removes that gap. When existing assets are visible and accessible, teams are far more likely to reuse them than to build from scratch.
4. Standardize metric definitions across dashboards
Inconsistent metric definitions are one of the most persistent sources of confusion in analytics environments. Business intelligence governance addresses this by establishing a single, authoritative definition for each metric — one that is documented, maintained, and referenced across all dashboards.
Standardization removes interpretive ambiguity that leads to conflicting reports and provides cross-functional teams with a shared analytical foundation.
How standardization improves clarity
| Without Standardization | With Standardization |
| Metrics vary across dashboards | Metrics remain consistent |
| Reports show conflicting values | Reports align across teams |
| Rework is frequent | Reuse becomes possible |
5. Introduce a formal dashboard request workflow
A structured intake process for new dashboard requests serves as a practical filter against duplication. Before a new dashboard is built, the workflow prompts a review of existing assets to determine whether the need is already addressed. Even a lightweight process at this stage prevents a meaningful volume of redundant development.
6. Monitor dashboard usage continuously
Usage analytics provide an objective basis for managing the dashboard portfolio within modern data analytics environments. Reports that see consistent traffic are clearly serving a purpose; those that go weeks or months without a view warrant closer scrutiny. Decisions about consolidation and retirement become data-driven rather than subjective when usage is tracked consistently.
7. Create a structured dashboard retirement process
Dashboard creation tends to receive far more process attention than dashboard retirement — which is precisely where sprawl accumulates. A formal retirement workflow closes that gap: identify low-usage dashboards, review them with relevant stakeholders, archive before deletion, and maintain a record of what was removed and why. Managing dashboards through their full lifecycle, not just at creation, is what keeps the environment sustainable.
Before vs After dashboard management strategy
| Without Strategy | With Strategy |
| Duplicate dashboards | Consolidated reporting |
| No ownership | Clear accountability |
| Conflicting metrics | Standard definitions |
| Increasing costs | Controlled usage |
When these practices operate together, the dashboard environment becomes significantly more manageable. Analytics teams recover capacity previously spent on maintenance, and the reporting layer regains its core function — supporting informed, confident decision-making.
FAQs
What is a dashboard sprawl in simple terms?
Dashboard sprawl describes a state in which an organization has accumulated more dashboards than it can effectively manage. Reports proliferate across teams and platforms; ownership becomes unclear, and users lose confidence in which report reflects the accurate picture. The dashboards exist — but they no longer serve as reliable decision-making tools.
Why does dashboard sprawl keep increasing over time?
Dashboard creation is fast and low friction; dashboard management is not. Teams respond to analytical requests by building new reports, while older dashboards remain active by default. Without BI governance providing clear rules around creation, review, and retirement, the volume compounds with no natural constraint.
How does BI governance help reduce dashboard sprawl?
BI governance introduces accountability and process at every stage of the dashboard lifecycle. It defines who owns each dashboard, what criteria a new dashboard must meet before it is built, and when existing dashboards should be reviewed or retired. Combined with business intelligence governance, it creates a consistent operational standard that limits duplication and restores trust in the reporting environment.
How long does it take to reduce dashboard sprawl?
The timeline depends on the scale of the environment and the depth of existing duplication. Organizations that implement a dashboard management strategy alongside a BI governance framework typically begin to see measurable improvement within a few months. More importantly, the governance structure that produces those early gains also prevents dashboard sprawl from re-emerging as the organization continues to grow.
Author


Yogita Jain
Content Lead
Yogita Jain leads with storytelling and Insightful content that connects with the audiences. She’s the voice behind the brand’s digital presence, translating complex tech like cloud modernization and enterprise AI into narratives that spark interest and drive action. With a diverse of experience across IT and digital transformation, Yogita blends strategic thinking with editorial craft, shaping content that’s sharp, relevant, and grounded in real business outcomes. At Cygnet, she’s not just building content pipelines; she’s building conversations that matter to clients, partners, and decision-makers alike.