


A payment API slows down for eight seconds during peak traffic. CPU usage looks normal. Memory usage stays flat. No infrastructure alert fires. Yet checkout abandonment jumps, support tickets spike, and a regional operations team starts routing calls manually.
That gap between “everything looks healthy” and “customers are clearly struggling” is where modern cloud infrastructure management becomes critical.
Most enterprises already collect telemetry. The problem is not data shortage. It is operational context. Teams can see dashboards, but they still cannot explain why a distributed workload behaved differently after a deployment, why latency moved between services without warning, or why a queue backlog only appears under a certain transaction path.
That is why Cloud observability has shifted from a tooling conversation into an operational discipline supported by cloud engineering services. The discussion is no longer about adding another dashboard widget. It is about building enough system context to explain behavior under pressure.
Enterprises are spending heavily on telemetry platforms while still struggling with fragmented visibility and rising operational noise. Several observability studies point to the same pattern: teams collect enormous amounts of telemetry, yet incident diagnosis still takes too long because operational signals remain disconnected.
Monitoring vs Observability in Modern Cloud Environments
Traditional monitoring was built for environments with predictable infrastructure boundaries. A server went down. Disk usage crossed a threshold. A network device stopped responding.
Modern cloud environments behave differently.
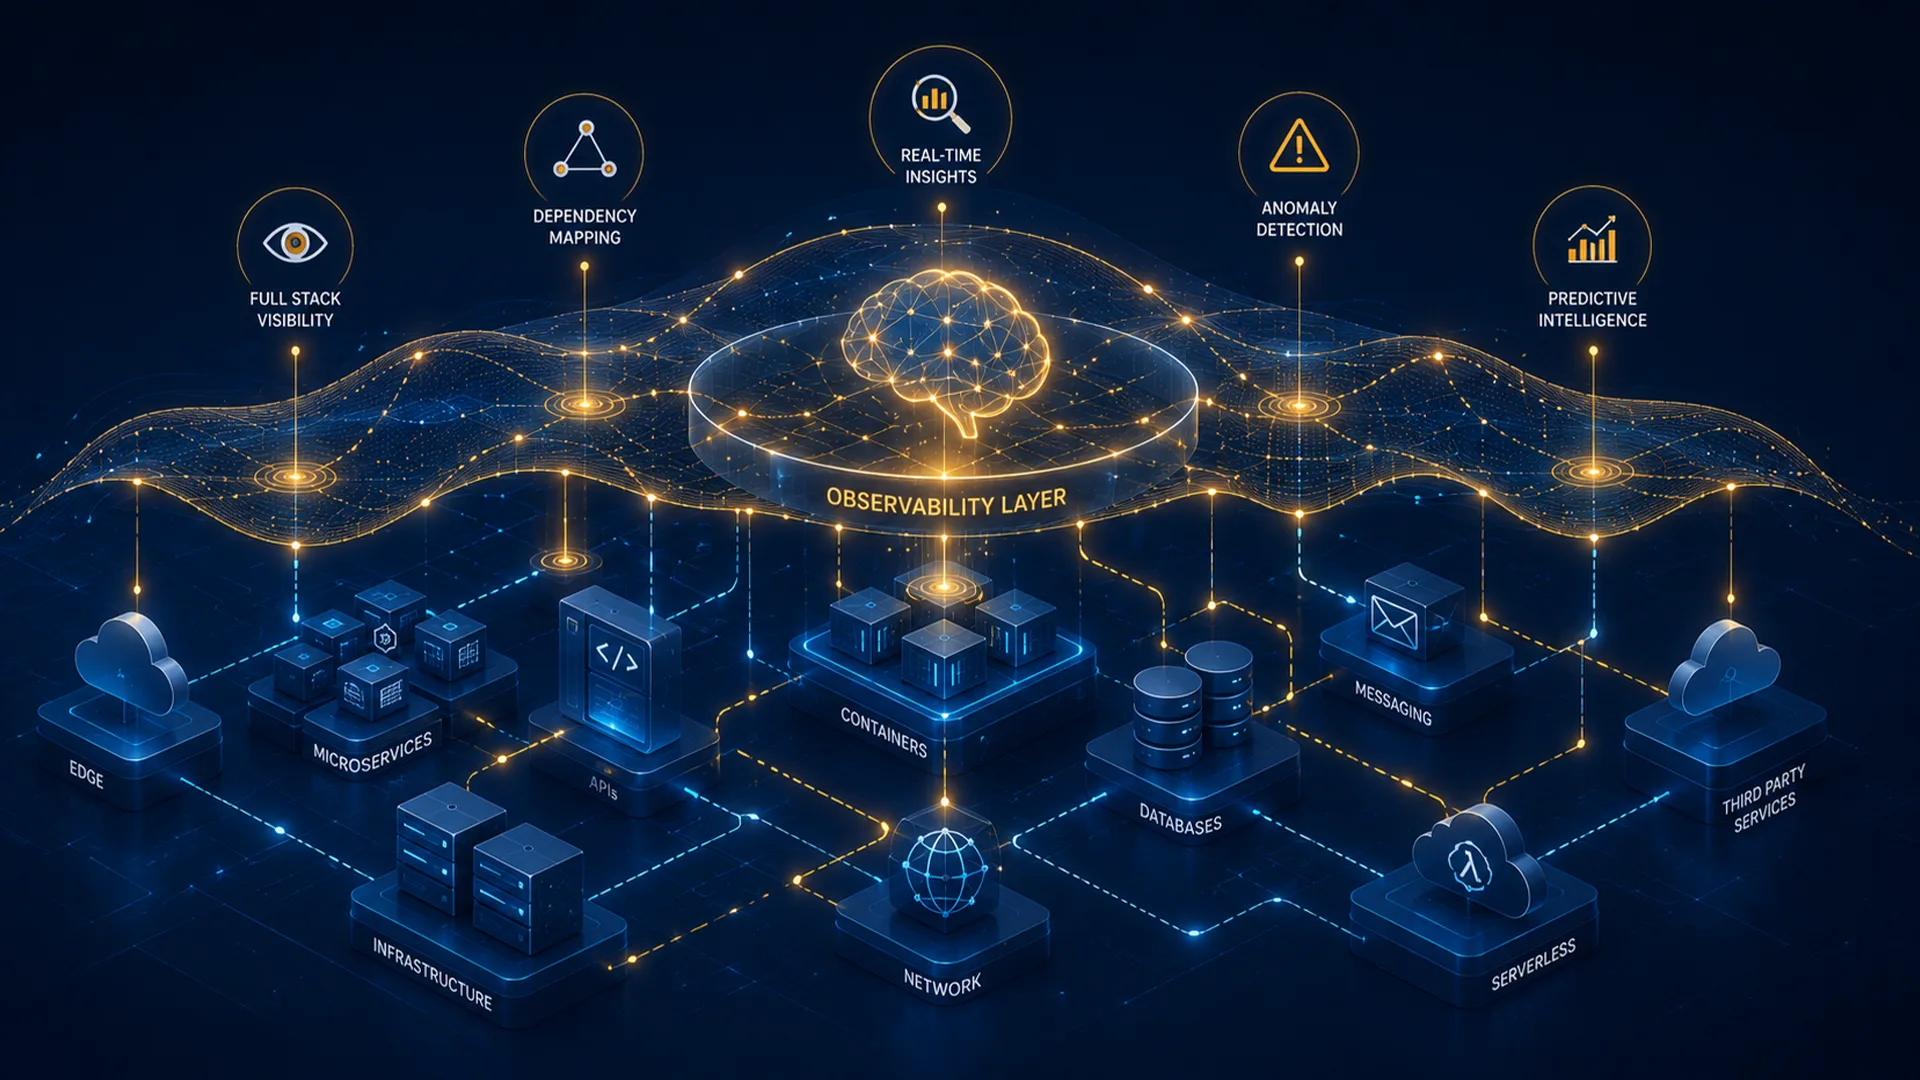
A single customer transaction may move through containers, serverless functions, APIs, managed databases, and AI inference services across a cloud-native architecture before completion. A failure inside one dependency can create symptoms somewhere else entirely.
This is where the discussion around observability vs monitoring cloud becomes important. Monitoring tells teams when a known condition appears. Observability helps teams investigate conditions they did not predict in advance. That distinction sounds subtle until a production incident begins.
During a recent financial services migration project, an engineering team discovered that intermittent latency spikes were not connected to infrastructure health at all. The issue came from asynchronous retries inside an authentication dependency after token refresh timing changed during deployment. Existing dashboards showed healthy compute usage throughout the incident.
The incident only became visible after tracing data exposed a repeated retry pattern across services.
This is why observability vs monitoring cloud matters in enterprise operations. One approach tracks predefined conditions. The other explains system behavior under uncertain conditions.
The conversation around real time monitoring vs observability often becomes unnecessarily binary. Enterprises still need monitoring. Alerting remains essential. Thresholds still matter.
But monitoring alone struggles when:
- Services communicate asynchronously
- Workloads shift dynamically across regions
- Dependencies exist outside direct infrastructure control
- AI workloads introduce unpredictable compute behavior
- Incident symptoms appear far away from the root cause
That operational gap is exactly why cloud operations observability is now central to incident response planning. In many enterprise reviews, observability vs monitoring cloud discussions now appear alongside resilience planning and release governance because operations teams need faster causal analysis during live incidents.
Key Components of Cloud Observability
Most technical articles explain telemetry categories in isolation. Real operations work differently. Logs without traces create guesswork. Metrics without request context create noise. Tracing without infrastructure correlation creates partial visibility.
The phrase “logs metrics traces explained cloud” usually gets treated as a beginner topic. In reality, experienced engineering teams still struggle with correlation between these signals.
Here is what changes when these signals work together:
| Signal | What it shows | What it misses alone |
| Metrics | System trends, saturation, latency, throughput | Root-cause sequence |
| Logs | Event-level details | Service relationships |
| Traces | Request journey across services | Long-term infrastructure trends |
Strong cloud observability depends on connecting these signals during active operations, not storing them in separate tools.
One retail enterprise reduced incident investigation time after tracing data revealed that a payment slowdown only appeared when inventory synchronization jobs ran at the same time as flash-sale traffic. Metrics showed rising latency. Logs showed timeout warnings. Traces exposed the exact transaction path causing resource contention.
Without correlation, every team saw only part of the problem.
Telemetry correlation becomes much more practical when framed around operational sequencing rather than telemetry categories.
Observability Tools Enterprise Cloud Teams Are Prioritizing
A few years ago, observability platforms were purchased mainly by infrastructure teams. That pattern has changed. Now platform engineering, security operations, FinOps teams, and application owners all depend on shared telemetry data.
This is why observability tools enterprise cloud discussions now focus less on dashboards and more on operational workflow integration.
The strongest enterprise setups in 2026 usually include:
- Opentelemetry-based instrumentation
- Distributed tracing pipelines
- Centralized event correlation
- Service dependency mapping
- AI-assisted anomaly grouping
- Policy-driven telemetry retention
- Operational runbook integration
Tool sprawl remains a serious issue. Several recent reports show enterprises frequently run multiple overlapping telemetry platforms, which creates rising operational cost and fragmented investigation workflows.
Many engineering leaders quietly admit the same frustration: teams spend huge amounts collecting telemetry yet still switch between three or four consoles during incidents. That operational friction has pushed cloud observability into platform engineering roadmaps instead of leaving it inside infrastructure operations alone.
That is why mature cloud operations observability programs increasingly prioritize interoperability over vendor expansion.
The conversation around observability tools enterprise cloud now includes governance questions as much as technical capability:
- Which telemetry data genuinely supports investigation?
- Which logs can be sampled safely?
- Which traces deserve longer retention?
- Which alerts produce operational fatigue?
- Which services require business-priority visibility?
These questions matter because telemetry volume itself has become an operational cost category.
Enterprise Use Cases for Observability-Driven Operations
Some of the biggest operational changes happening quietly inside enterprise engineering teams are:
- Operations decisions are becoming dependency-aware
- Earlier operations models focused on infrastructure status
- Modern cloud operations observability focuses on transaction impact
- That changes how teams respond during incidents
For example:
A CPU alert may no longer trigger immediate escalation if tracing shows customer transactions remain healthy.
Meanwhile a small latency increase inside an authentication service may receive immediate attention if traces show it affects payment completion paths.
This is where cloud ops decision making using observability becomes operationally valuable.
The strongest teams now combine telemetry with business context:
- Revenue-sensitive transaction paths
- Customer session degradation
- Regional workload behavior
- Deployment sequencing
- Dependency risk scoring
- API consumption anomalies
This shift matters because many outages no longer begin as full infrastructure failures. They begin as behavioral drift.
- A service retries slightly more often.
- A queue waits slightly longer.
- A dependency adds small latency during authentication.
- Individually, these signals may look harmless.
- Together, they create production instability.
That is why cloud observability increasingly supports operational forecasting instead of simple incident reaction. Mature engineering groups increasingly frame observability vs monitoring cloud as a question of operational depth rather than tooling preference.
The discussion around real time monitoring vs observability becomes much clearer at this point. Monitoring reacts to visible conditions. Observability explains invisible interactions before visible failure appears.
Business Impact of Cloud Operations Observability
Executives rarely care about telemetry pipelines.
They care about downtime, customer friction, release velocity, operational waste, and incident recovery.
That is where cloud operations observability starts influencing board-level conversations.
A mature observability practice affects business operations in several direct ways:
| Operational Area | Business Result |
| Faster incident diagnosis | Lower outage duration |
| Dependency visibility | Better release confidence |
| Telemetry correlation | Lower operational fatigue |
| AI workload visibility | Better infrastructure efficiency |
| Service mapping | Reduced operational duplication |
Recent observability studies increasingly connect telemetry maturity with customer experience quality, operational efficiency, and AI workload management. There is another financial angle that receives less attention. Poor telemetry strategy becomes expensive quickly.
Many enterprises now spend substantial portions of their infrastructure budget on telemetry ingestion and storage alone. Several reports highlight growing concern around observability cost management and redundant telemetry collection.
This changes how cloud observability programs are designed. High-performing teams no longer collect everything forever. Instead, they focus on:
- Priority-based telemetry retention
- Adaptive trace sampling
- Business-critical visibility paths
- Operational signal quality
- Investigation-focused instrumentation
That mindset creates cleaner operational workflows and lower telemetry waste. The most mature cloud observability programs now treat telemetry quality as seriously as infrastructure performance.
A Practical Maturity Model for Observability-Driven Cloud Operations
Most maturity models in this space are too theoretical. In practice, enterprises usually move through five operational stages.
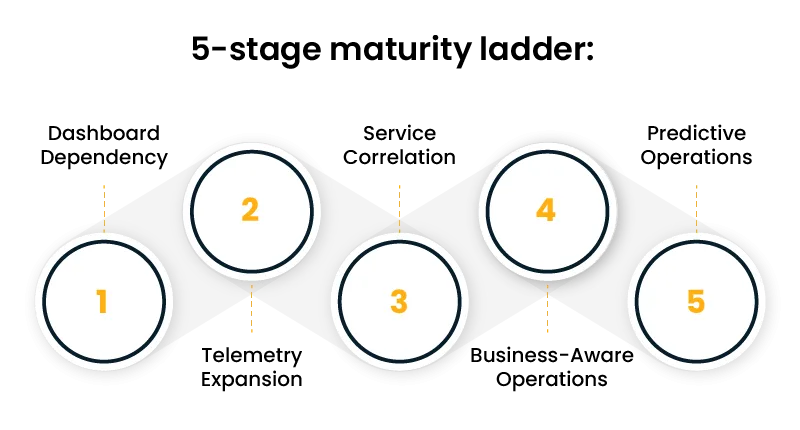
Stage 1: Dashboard Dependency
Teams rely heavily on infrastructure dashboards and threshold alerts.
Symptoms:
- Alert overload
- Long incident diagnosis cycles
- Heavy manual investigation
- Weak service dependency visibility
This stage usually produces the first serious observability vs monitoring cloud discussions. Teams begin realizing that observability vs monitoring cloud is not a vendor comparison but an operational capability gap.
Stage 2: Telemetry Expansion
Teams begin centralizing logs, traces, and metrics.
Common outcomes:
- Better visibility
- Rising telemetry cost
- Tool fragmentation
- Inconsistent instrumentation
This is where logs metrics traces explained cloud becomes operational rather than academic.
Stage 3: Service Correlation
Engineering teams connect telemetry across application layers. At this stage, cloud operations observability becomes part of release management, platform engineering, and incident response. Teams start identifying behavioral drift before visible outages appear.
Stage 4: Business-Aware Operations
Telemetry begins aligning with customer journeys and revenue-sensitive workflows.
This is where cloud ops decision making using observability starts influencing operational prioritization. Incident severity gets tied to customer impact instead of infrastructure metrics alone.
Stage 5: Predictive Operations
This is still rare. Teams use behavioral telemetry patterns, dependency analysis, and AI-assisted investigation workflows to identify instability earlier.
Several newer enterprise observability programs are already experimenting with automated triage systems that reduce investigation time significantly during complex incidents.
At this stage, cloud observability becomes part of operational planning itself. In highly distributed environments, cloud operations observability starts influencing deployment sequencing, rollback strategy, and dependency isolation planning.
Why This Shift Matters More in 2026 Than It Did Three Years Ago
Cloud environments have become operationally denser. AI services, distributed APIs, multi-region architectures, event-driven workloads, and third-party integrations now create dependency chains that older monitoring approaches were never designed to interpret.
That complexity changes operational expectations. Engineering leaders are no longer asking whether telemetry exists; they are asking how aws cloud consulting services can turn telemetry into operational clarity. They are asking whether telemetry explains system behavior clearly enough to support fast operational judgment.
That question sits at the center of every serious observability vs monitoring cloud conversation happening right now. The most experienced operations leaders already view observability vs monitoring cloud as a reliability strategy issue, not a dashboard modernization project.
The strongest teams are moving away from “dashboard watching” and toward operational context systems that connect infrastructure behavior, application dependencies, and business impact in one investigation flow.
That is the real direction of cloud operations observability. Not prettier dashboards. Operational clarity under pressure. And in modern cloud environments, that difference decides whether incidents remain contained or quietly spread across the business.
Author


Yogita Jain
Content Lead
Yogita Jain leads with storytelling and Insightful content that connects with the audiences. She’s the voice behind the brand’s digital presence, translating complex tech like cloud modernization and enterprise AI into narratives that spark interest and drive action. With a diverse of experience across IT and digital transformation, Yogita blends strategic thinking with editorial craft, shaping content that’s sharp, relevant, and grounded in real business outcomes. At Cygnet, she’s not just building content pipelines; she’s building conversations that matter to clients, partners, and decision-makers alike.