




































Analytics programs often reach a stage where access is no longer the main problem. Business teams already have dashboards, scheduled reports, and self-service tools. The harder question is whether those analytics are influencing the decisions made in planning meetings, operational reviews, approvals, and day-to-day execution.
This is where analytics adoption becomes more than a question of usage, especially when enterprises connect analytics work to data analytics use cases that influence real business decisions. A dashboard may be opened regularly and still sit outside the actual decision process. Teams may continue using spreadsheets, manual summaries, or familiar judgment calls because those methods are already built into how work moves from one person to another.
The gap is significant because enterprise investment in business intelligence remains strong. Dresner Advisory Services’ 2026 Wisdom of Crowds BI Market Study found that just over 52% of respondent organizations planned to increase BI investment compared with 2025. More investment can expand analytics access, but it does not automatically create consistent decision use.
An analytics adoption roadmap helps address that gap by focusing on how analytics fits into business routines, where data analytics services help connect dashboards, metrics, workflows, and decision outcomes. It connects stakeholder responsibilities, workflow placement, role-based training, feedback, governance, and recurring decision reviews. The objective is to make trusted analytics part of the work itself, rather than another source employees have to remember to consult.
Microsoft’s current Fabric adoption guidance reinforces this distinction. Usage statistics provide useful signals, but effective adoption depends on whether analytics becomes part of regular working practices across creators, consumers, and business stakeholders. For enterprises, the next step is clear: measure adoption by how reliably analytics informs action, not by how often a report is opened.
Why Analytics Reports Fail to Change Business Decisions
Most reporting programs are built around outputs. Business adoption is built around decisions.
That difference changes the design brief. A report asks, “What should we show?” A decision asks, “What must someone know before choosing an action?”
When teams start with reports, they often produce useful information without defining the decision it should influence. A weekly margin dashboard may have dozens of views, but a regional manager still needs to know whether to change pricing, shift inventory, question a discount, or accept the variance. If the report stops before that point, the user has to create the final mile alone.
This is one reason business intelligence adoption can look healthy in platform metrics while remaining weak in operating practice, creating the same problem enterprises face with dashboard sprawl. Logins and dashboard views show activity. They do not prove that evidence affected a decision.
A better diagnostic is to inspect the meeting, approval, handoff, or exception process where the decision already occurs. Then ask five questions:
- What decision is being made?
- What signal should trigger attention?
- Which metric or analysis informs the choice?
- Who owns the action?
- Where is the decision recorded or reviewed?
These questions form a simple decision adoption framework. It shifts the unit of adoption from “user opened dashboard” to “evidence entered the decision process.”
What Does Analytics Adoption Actually Mean?
Analytics adoption has three practical layers.
First is access. People can reach trusted information without waiting for a specialist. Second is interpretation. They understand the measure, context, threshold, and limits. Third is decision use. The information appears at the point where action is selected, approved, deferred, or escalated.
Many programs spend heavily on the first layer and assume the other two will follow. Deliberate design is usually required.
A 2025 Strategy survey found that only 8% of employees in most respondent organizations were using advanced analytics tools, even as many organizations planned wider use. The exact percentage will differ by organization, but the pattern is familiar: availability can spread faster than confident use.
That is why an analytics adoption roadmap should define target behaviors by role. A finance controller does not need the same interaction pattern as a sales manager. A plant supervisor may need alerts, while an executive may need a small set of governed metrics with clear commentary.
Adoption becomes measurable when each role has a defined analytical behavior tied to a real responsibility.
How to Map Stakeholders Before Building an Adoption Plan
Stakeholder mapping should show how each group participates in a decision.
A practical map can look like this:
| Stakeholder role | Decision responsibility | Analytics need | Adoption risk |
| Executive sponsor | Sets priorities and resolves conflicts | Trusted enterprise indicators | Uses analytics only in review meetings |
| Functional leader | Approves actions and trade-offs | Context, trends, exceptions | Maintains parallel spreadsheet logic |
| Frontline manager | Makes frequent operating decisions | Timely thresholds and alerts | Sees dashboards as extra work |
| Analyst | Interprets and explains evidence | Governed data and reusable logic | Becomes a permanent human interface |
| Data or BI team | Maintains products and standards | Usage, quality, support signals | Optimizes platform activity instead of decision value |
This mapping changes analytics change management because communication can address the disruption each role actually experiences. A manager may fear losing a familiar spreadsheet, while a leader may question whether a new metric can be trusted in a formal review.
Microsoft’s change management guidance explicitly calls out deeply ingrained export and spreadsheet processes as a source of adoption friction, which is why change needs to be handled incrementally and with clear impact analysis.
How to Embed Analytics Into Daily Business Workflows
The strongest adoption move is often analytics workflow integration.
Instead of asking users to remember that a dashboard exists, place the analytical signal inside the work they already perform. A forecast exception can appear before a demand review. A margin variance can be attached to a pricing approval. A service threshold can enter an operations queue. A customer-risk indicator can sit beside the account review.
This creates a simple design rule: analytics should arrive before the decision expires.
For each priority workflow, document the trigger, evidence, decision owner, required action, and follow-up. That becomes the operating spine of the analytics adoption roadmap.
A useful pattern is:
Trigger → Evidence → Interpretation → Decision → Action → Review
Without review, teams cannot tell whether the insight was useful or whether the decision rule needs adjustment.
Good analytics workflow integration also reduces the distance between insight and action. Teams should not have to export data, rebuild it elsewhere, ask an analyst for interpretation, and then return to the original system to act. Each handoff creates delay and another chance for the decision to drift away from governed evidence.
Why Analytics Training Should Follow Real Decisions
Generic product training teaches navigation. Adoption training teaches judgment.
Users need to know which metric applies, what changes its meaning, when a threshold deserves action, what they can investigate themselves, and when they should escalate. This approach creates data-driven decision habits because learning is anchored to work that already matters.
A sales manager training session can use a real pipeline review. The learner isolates an exception, compares it with the agreed benchmark, records a reason, and decides the next action.
This also improves business intelligence adoption because training stops being a one-time rollout event. New decisions, new metrics, role changes, and recurring support questions become inputs for targeted learning.
Microsoft’s adoption guidance places mentoring and user enablement alongside governance, support, and community practices rather than treating training as a single deployment task.
How Feedback Loops Keep Analytics Useful
Low adoption is often treated as user resistance. Sometimes the product deserves the criticism.
Business teams abandon analytics when refresh timing is wrong, metric definitions feel opaque, alerts create noise, or the product takes too many steps to answer a time-sensitive question. Those are design signals.
An effective analytics adoption program captures them continuously. Support tickets help, but they usually record problems after frustration appears. Add shorter feedback points around real decision moments:
- Which view did you use before the decision?
- What information was missing?
- Did you leave the product to calculate or verify something?
- Was the recommended action clear?
- Did the result of the decision get reviewed later?
These questions give analytics change management a practical feedback channel. They also reveal whether the problem sits in data quality, metric design, user skill, workflow placement, or decision ownership.
How to Build a Practical Analytics Adoption Roadmap
A useful analytics adoption roadmap should be organized by business behavior rather than by feature release, supported by business analytics services that help improve planning, reporting, and decision consistency.
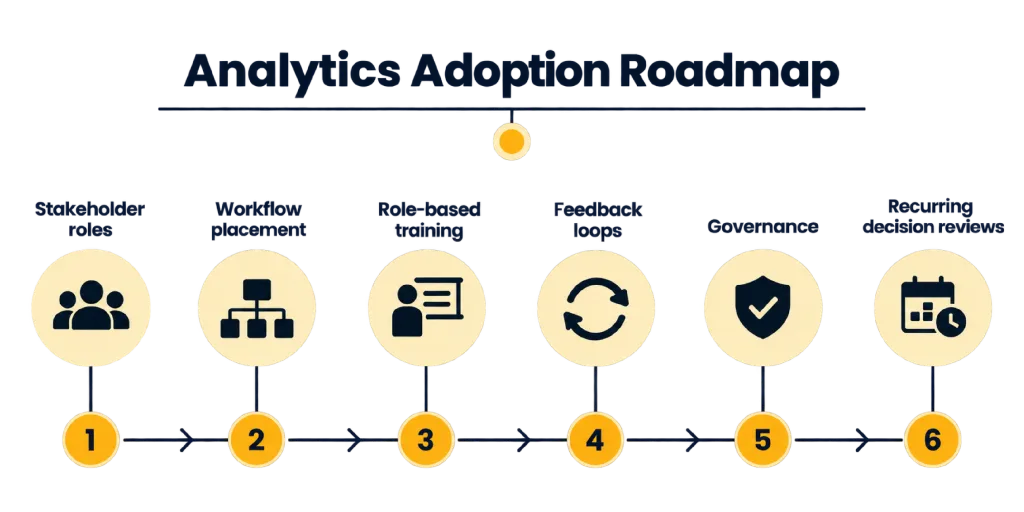
| Roadmap stage | Business objective | Evidence of progress |
| Decision inventory | Identify recurring decisions with measurable business impact | Named owners, triggers, evidence needs |
| Adoption baseline | Understand current reports, workarounds, trust gaps, and usage patterns | Role-level baseline and friction log |
| Workflow placement | Put trusted analytics at the point of action | Fewer manual handoffs and duplicate calculations |
| Role enablement | Train users around actual decisions | Higher independent interpretation and action |
| Decision review | Compare expected and actual outcomes | Documented learning and adjusted thresholds |
| Operating cadence | Make adoption part of management routines | Repeated review of usage, decisions, and friction |
Start with a small number of decision journeys where ownership is clear and outcomes can be observed. This makes the decision adoption framework testable before wider use.
For each journey, assign one business owner and one analytics owner. The business owner is accountable for how the decision is made. The analytics owner is accountable for the quality, usability, and traceability of the evidence.
This pairing prevents a common failure mode: the BI team owns adoption while business leaders own the decisions. Adoption weakens because authority and accountability sit in different places.
How to Measure Analytics Adoption Beyond Dashboard Logins
An analytics adoption scorecard should combine platform usage with decision evidence.
Useful measures include repeated use by target roles, priority decisions supported by governed analytics, reduction in manual reconciliation, time between signal and action, unresolved metric disputes, and post-decision review frequency.
Microsoft’s adoption tracking guidance recommends defining what adoption means for the organization, identifying the behaviors to encourage, assigning ownership, and acting on what the tracking reveals. That principle is more useful than chasing a universal adoption benchmark.
The best measure depends on the decision. Procurement may care about exception response, finance about reconciliation effort, and sales about whether forecast reviews use the agreed metric set.
The purpose is to build data-driven decision habits that can be seen in work, not inferred from page views.
What Makes Analytics Adoption Roadmap Sustainable?
The final stage is management discipline.
The roadmap should become part of the operating model for analytics, with recurring reviews of decision coverage, user friction, training needs, data trust, metric changes, and outcomes. Monthly reviews can address adoption barriers, while quarterly reviews can test whether priority decisions still match business goals.
This is where analytics adoption moves from a project concern to an operating responsibility. It also gives leaders a clearer basis for deciding where additional analytics investment is justified.
The practical test remains simple: when a recurring business decision appears, do people know which evidence to use, trust its meaning, act within the required window, and review what happened afterward?
If that sequence is visible, analytics is becoming part of the business. If it is missing, another dashboard will rarely fix the problem.
Author


Yogita Jain
Content Lead
Yogita Jain leads with storytelling and Insightful content that connects with the audiences. She’s the voice behind the brand’s digital presence, translating complex tech like cloud modernization and enterprise AI into narratives that spark interest and drive action. With a diverse of experience across IT and digital transformation, Yogita blends strategic thinking with editorial craft, shaping content that’s sharp, relevant, and grounded in real business outcomes. At Cygnet, she’s not just building content pipelines; she’s building conversations that matter to clients, partners, and decision-makers alike.