


Most businesses generate more data than they know what to do with. Raw data sitting in a warehouse does not improve decisions. The method of analysis determines whether that data produces an observation, an explanation, a forecast, or a recommendation.
Each type answers a different kind of question, operates at a different level of complexity, and requires a different level of organizational capability to execute. The gap between a business running descriptive dashboards and one running prescriptive models is in what those businesses know, how far ahead they can see, and how quickly they can act.
This blog breaks down the four types of data analytics, explains how they work together across an analytical continuum, and provides a framework for choosing which type best fits a given business objective.
Whether a business is building its first analytical infrastructure or looking to advance beyond reporting toward predictive and prescriptive capability, the starting point is understanding what each type actually does.
What are the Different Types of Data Analytics?
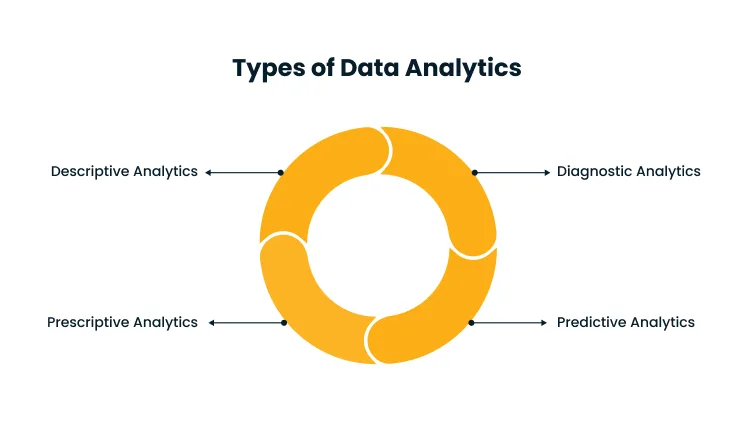
The four types of data analytics form a progressive hierarchy, each building on the layer before it.
- Descriptive analytics shows what has happened.
- Diagnostic analytics explains why.
- Predictive analytics forecasts what is likely to come.
- Prescriptive analytics recommends what to do about it.
Each stage adds a distinct layer of analytical capability and a different kind of business value. Understanding what each type does and how they differ is the starting point for building a data strategy that moves beyond reporting.
1. Descriptive Analytics
Descriptive analytics processes historical data to summarize business performance across a defined time period. Reports, dashboards, and KPIs are all descriptive tools. They aggregate and present what has already occurred in a format that decision-makers can read and act on.
The value here is visibility. An organization that knows how many units it sold last quarter, where customer churn is concentrated, or which product lines drove the most revenue is positioned to ask better questions.
Without this foundation, all subsequent analysis lacks grounding. Common outputs include:
- Monthly and quarterly performance reports
- Revenue and sales dashboards
- Customer behavior summaries
- Operational KPIs and scorecards
Descriptive analytics does not explain causes or anticipate outcomes. It records and presents the state of the business at a given point in time, precisely and reliably.
2. Diagnostic Analytics
Diagnostic analytics moves past the “what” and investigates the “why.” When a KPI shifts unexpectedly or a trend breaks from its pattern, diagnostic analysis examines the relationships, anomalies, and contributing factors that explain the outcome.
The methods go deeper than summary statistics. Drill-down analysis, data discovery, and correlation analysis help teams trace performance problems back to their source.
A retailer might use descriptive analytics to see that Q3 sales fell, then use diagnostic analytics to identify that the decline was concentrated in one region, driven by a delayed inventory replenishment cycle.
Diagnostic analytics requires granular, structured data, in addition to aggregate metrics. Common techniques include:
- Root cause analysis
- Variance and cohort analysis
- Segmentation and anomaly detection
- Cross-functional data investigation
3. Predictive Analytics
Predictive analytics uses statistical models and machine learning to forecast what is likely to happen, based on patterns found in historical data. Where descriptive analytics reports past performance and diagnostic analytics investigates past failures, predictive analytics shifts the analytical focus forward.
A manufacturer predicting equipment failure before it occurs, a bank scoring loan default risk before issuing credit, or a retailer forecasting demand for the next quarter are all predictive analytics use cases.
The models learn from historical patterns and generate probability-weighted outcomes.
Predictive accuracy depends heavily on data quality and volume. Models trained on incomplete, biased, or outdated data produce unreliable forecasts. This is why predictive analytics typically requires a mature data infrastructure beneath it.
Common applications include:
- Demand and sales forecasting
- Customer churn prediction
- Risk scoring and fraud detection
- Inventory optimization
4. Prescriptive Analytics
Prescriptive analytics is the most advanced of the four types. It does not simply forecast outcomes. It recommends the actions most likely to produce a desired result.
Prescriptive models evaluate multiple possible decisions, simulate their consequences, and surface the optimal course of action.
The practical output is a specific recommendation, like reprice this product by 8 percent, route this shipment through this corridor, or reassign this field team to reduce response time.
These recommendations account for constraints, business rules, and trade-offs that a human decision-maker would otherwise have to evaluate manually.
Prescriptive analytics is most powerful when decision variables are numerous and interdependent. Logistics routing, workforce scheduling, and dynamic pricing are domains where prescriptive models consistently outperform human judgment at scale.
How 4 Types of Data Analytics Work Together
Data analytics is not four independent disciplines that happen to share a name. It is a progressive system where each stage depends on and extends the one before it.
Understanding how these types connect reveals why organizations operating only at the descriptive level leave consistent value unrealized, and what it takes to move further along the continuum.
1. The Data Analytics Continuum: From Insight to Action
The analytics continuum moves from understanding what happened, to explaining why it happened, to anticipating what will happen, to determining what should be done about it.
Each stage adds more analytical complexity and generates more strategic value than the one before it.
Descriptive analytics addresses the past through observation. Diagnostic analytics investigates the past to uncover causal relationships. Predictive analytics projects into the future. Prescriptive analytics closes the loop by converting those projections into executable decisions.
The stages are not equal in maturity requirements. Moving from descriptive to diagnostic demands cleaner data and more sophisticated querying.
Moving from diagnostic to predictive requires statistical modeling capability. Reaching prescriptive requires optimization infrastructure and an organizational culture willing to act on model-generated recommendations.
2. How Each Type Builds on the Previous One
Each type in the continuum depends on the layer beneath it. Remove any stage from the chain, and the subsequent types degrade.
Descriptive analytics produces the historical record that diagnostic analytics investigates. Diagnostic analytics identifies the patterns and causal factors that predictive models learn from.
Predictive analytics generates the probabilistic forecasts that prescriptive models evaluate when weighing decision options.
An organization attempting to run predictive models without clean historical data will produce unreliable outputs. A prescriptive system built on poor predictive accuracy will recommend flawed actions. The integrity of each stage determines the quality of every stage that follows.
3. End-to-End Workflow Example (From Data to Decision)
Consider a retail business monitoring its sales performance. Descriptive analytics surfaces a revenue decline across two product categories over a six-week period. Diagnostic analysis reveals the decline correlates with a competitor price reduction and a recent product page redesign that increased bounce rate.
With that causal understanding, a predictive model forecasts continued revenue decline over the next quarter if no action is taken, estimating a 14% drop based on patterns from comparable historical periods.
The prescriptive layer then evaluates available levers, such as price adjustment, a promotional campaign, or restoring the original product page.
Accounting for margin constraints and historical campaign ROI, it recommends a targeted price adjustment in one category combined with a limited promotional push in the other.
Each stage could not have functioned without the one preceding it. The final decision was the output of a connected analytical system.
4. Combining Analytics Types for Better Business Outcomes
Organizations that use multiple analytics types in combination consistently produce more accurate, faster, and more defensible decisions than those relying on reporting alone.
The complementary effect is measurable. Descriptive analytics sets the baseline. Diagnostic analytics adds explanation. Predictive analytics introduces foresight. Prescriptive analytics converts foresight into action.
Each layer strengthens the next, compounding the return on every prior analytical investment.
Operationally, combining these types also distributes analytical effort appropriately. Descriptive tools handle routine reporting automatically, freeing analysts to focus on diagnostic work where anomalies actually appear. Predictive and prescriptive models then operate on top of that refined understanding.
5. Where Most Organizations Break in the Analytics Flow
Most organizations are further along in analytical aspiration than in analytical capability. A large share invests in dashboards and reporting tools and stops there, consuming descriptive outputs without the infrastructure, skills, or organizational culture to move further.
Common failure points include:
- Data quality problems that make diagnostic analysis unreliable
- Absence of data science capability to build and maintain predictive models
- Organizational culture that defers to intuition over model-generated recommendations
- Siloed data that prevents the cross-functional analysis, diagnostic, and predictive stages requires
- Technology gaps where reporting tools exist, but the modeling infrastructure does not
According to Gartner’s 2024 CDAO Agenda Survey, just one in three organizations has implemented decision intelligence to date. When no one is accountable for advancing analytics maturity, investment concentrates on the most familiar and visible layer (the dashboard) and stays there.
6. Moving from Reporting to Predictive and Prescriptive Analytics
Advancing from descriptive reporting to predictive and prescriptive capability is a deliberate organizational transition. Three dimensions must move in parallel.
Data quality comes first. Predictive models are only as accurate as the data they learn from. According to IBM’s 2025 report on data quality, 43% of chief operations officers identify data quality as their most significant data priority, making it a recognized barrier long before any modeling investment is considered.
Before building modeling infrastructure, organizations need data that is clean, complete, consistently structured, and accessible across systems.
Capability development follows. Predictive analytics requires analysts or data scientists with statistical modeling skills. Prescriptive analytics requires optimization and simulation expertise.
Both require organizational stakeholders who understand the outputs well enough to act on them.
Finally, the analytical function needs to be embedded in decision workflows. Models that produce recommendations no one acts on do not generate value. Closing the gap between insight and action is as much an organizational challenge as a technical one.
Cygnet.one’s Business Analytics and Embedded AI services are built around exactly this principle, delivering analytics capabilities directly within the systems where teams already work, so insights reach decision-makers at the point where they matter.
Which Type of Data Analytics Should You Use
Choosing the right type of analytics is a strategic question. The type of analytics that adds the most value at any given point depends on what decision needs to be made, how complex that decision is, and what data is available to support it.
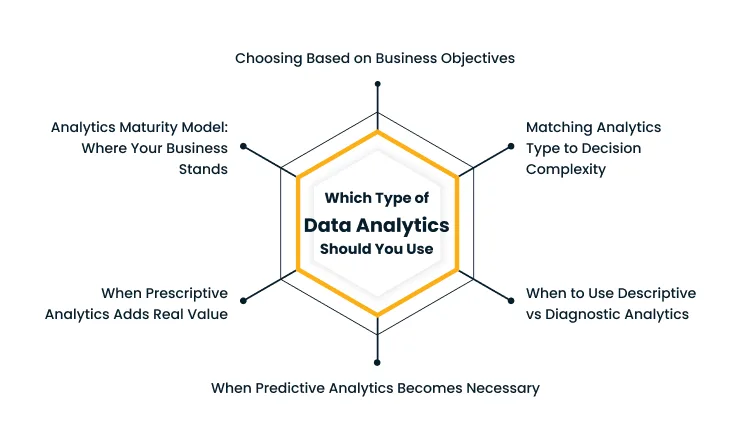
Starting from the wrong point wastes analytical investment and organizational attention in equal measure.
1. Choosing Based on Business Objectives
Every analytics initiative starts with a business objective, and the objective determines which type of analytics is most relevant.
If the goal is to understand and communicate current performance, whether for board reporting, operational monitoring, or team accountability, descriptive analytics is the right choice.
When the goal shifts to investigating why performance changed, diagnostic analytics takes over. When the business needs to anticipate market conditions, customer behavior, or operational risks, predictive analytics becomes the right investment.
When the goal is to optimize a complex, multi-variable decision in near real-time, prescriptive analytics is the appropriate level.
Applying predictive tools to a reporting problem is over-engineering. Applying descriptive tools to a decision optimization problem is under-equipped. Alignment between the objective and analytics type is the first condition for value creation.
2. Matching Analytics Type to Decision Complexity
Decision complexity is a reliable indicator of which analytics level is needed.
Simple, recurring decisions benefit from descriptive analytics. Knowing that this month’s sales are down 12% relative to the prior month is enough to trigger a standard operational response.
Moderately complex decisions, where context and causality matter, benefit from diagnostic analytics. Understanding why churn increased before deciding how to respond prevents misaligned remediation.
Highly complex decisions involving uncertainty about the future require predictive analytics. Allocating marketing budget across channels, planning inventory for seasonal demand, or identifying at-risk accounts before they churn all require probabilistic foresight.
Decisions with many interdependent variables, binding constraints, and significant trade-offs are the domain of prescriptive analytics. Logistics route optimization, dynamic pricing, and workforce allocation are examples where prescriptive models consistently outperform manual judgment.
3. When to Use Descriptive vs Diagnostic Analytics
Descriptive analytics is the right choice when the objective is visibility and communication. Use it to track KPIs, monitor performance trends, produce regular operational reports, and give leadership a consistent view of business health.
Diagnostic analytics becomes necessary when a descriptive output raises a question that reporting cannot answer. A drop in conversion rate triggers the question: what changed? A spike in support tickets raises the question: what is causing this, and where is it concentrated?
The clearest signal to move from descriptive to diagnostic is the presence of an unexplained anomaly or a performance gap material enough to investigate. Diagnostic analysis is more resource-intensive than descriptive reporting, so applying it selectively to questions that matter most is the right operating model for most teams.
4. When Predictive Analytics Becomes Necessary
Predictive analytics becomes necessary when the business faces forward-looking decisions where the cost of being wrong is high and sufficient historical data exists to learn from.
Three conditions signal when predictive investment is justified:
1. The decision involves uncertainty about future conditions, whether market demand, customer behavior, or operational risk events.
2. The volume and velocity of decisions make manual forecasting impractical or inconsistent.
3. Historical data is available in sufficient volume and quality to train a reliable model.
Businesses with long planning horizons, large variable cost structures, or customer portfolios where churn or growth materially affects revenue are strong candidates for predictive analytics investment.
5. When Prescriptive Analytics Adds Real Value
Prescriptive analytics deliver real value when the decision space is too complex for human judgment to navigate reliably or quickly.
The hallmarks of a prescriptive analytics opportunity are multiple simultaneous decision variables, binding constraints, and measurable trade-offs where optimizing for one objective affects others.
Logistics and supply chain operations are a clear example. Routing a fleet of delivery vehicles across a regional network involves dozens of simultaneous variables, such as traffic conditions, vehicle capacity, delivery priority, time windows, and fuel costs.
Prescriptive optimization finds solutions that outperform even experienced human dispatchers at scale.
Prescriptive analytics is not the right tool for every decision. For straightforward or low-stakes choices, the cost and complexity of a prescriptive system exceed the value it returns.
The right test is whether the decision is genuinely optimization-constrained. When it is, prescriptive analytics consistently returns measurable business value.
6. Analytics Maturity Model: Where Your Business Stands
Organizations evolve through recognizable stages of analytics maturity, and the right investment at each stage depends on where they currently sit.
At the lowest maturity level, analytics means spreadsheets, ad-hoc reports, and manual data pulls. Data is inconsistent, siloed, and rarely used to systematically inform decisions.
The intermediate stage introduces structured reporting through dashboards and BI tools. Data infrastructure exists but is largely used for monitoring rather than investigation or forecasting.
At the advanced stage, organizations run diagnostic analysis systematically, investigate performance gaps with rigor, and have invested in clean, integrated data. Predictive models are beginning to be deployed in specific high-value use cases.
At the highest maturity level, predictive and prescriptive analytics are embedded in core business processes. Models run in production, recommendations inform real decisions, and the organization tracks and improves model performance over time.
Most mid-market organizations sit between the intermediate and advanced stages. Knowing where the gaps lie in data quality, capability, or process integration determines what the next investment should be.
Practical Framework to Select the Right Analytics Type
A four-step framework can help organizations align their analytical approach to the specific decision at hand.
1. Define the decision: What needs to be decided, and what is the cost of getting it wrong? A vague problem cannot be matched to a precise tool.
2. Assess available data: What historical data exists, how clean is it, and does it cover the variables on which the decision depends? Data quality determines which analytics types are feasible.
3. Determine required insight: Is the insight retrospective, explanatory, probabilistic, or prescriptive? The required insight type maps directly to the analytics type.
4. Choose the appropriate level: Match the analytics type to the required insight. If the gap between current capability and the required analytics type is large, define a capability roadmap rather than attempting to skip stages.
This framework prevents over-investment in analytical sophistication that the organization is not yet ready to act on, and under-investment in cases where the decision genuinely demands advanced capability.
Conclusion
Most organizations treat analytics as a reporting function and leave the more powerful analytical stages untouched because the connection between analytical type and business decision is rarely made explicit.
Descriptive and diagnostic analytics alone can deliver significant value when applied with rigor. Predictive and prescriptive analytics extend that value further, but only when the data and organizational foundations are solid enough to support them.
The practical question is which type is most appropriate for the decision being made right now. Answering that question clearly and building capability one stage at a time produces better analytical outcomes than investing in sophisticated tools before the groundwork exists.
According to McKinsey’s analysis of data-driven commercial growth, organizations with data-driven growth strategies report EBITDA improvements of 15 to 25% over time, a return that compounds as analytical maturity advances.
Building analytics capability that moves beyond reporting requires getting the data foundation right before the tooling.
Cygnet.one’s Data Analytics and AI services help enterprises assess their current analytical maturity, close data quality gaps, and build toward predictive and prescriptive capability where it adds the most value.
Book a demo with Cygnet.one and see where your analytics program stands and what the next stage of development looks like.
Author


Abhishek Nandan
AVP, Marketing
Abhishek Nandan is the AVP of Services Marketing at Cygnet.One, where he drives global marketing strategy and execution. With nearly a decade of experience across growth hacking, digital, and performance marketing, he has built high-impact teams, delivered measurable pipeline growth, and strengthened partner ecosystems. Abhishek is known for his data-driven approach, deep expertise in marketing automation, and passion for mentoring the next generation of marketers.