




































A service report can be technically accurate and still hide poor performance. A provider may close 96% of tickets within target while users continue to face recurring outages, slow devices, failed changes, and vague incident updates. The figures look healthy because the measurement system rewards closure. The business experiences something else.
This is why provider assessment has to begin with the question behind the number. What did the metric reveal about service health, user impact, control, or prevention? Strong managed IT provider metrics connect operational activity with business exposure, supported by managed IT services that align monitoring, support, reporting, and resilience outcomes. Useful IT service KPIs show whether support is becoming more dependable, efficient, and easier to govern.
A shorter set of well-defined measures can expose weak ownership, unstable services, and reporting gaps within minutes, while data analytics services help connect incident, ticket, SLA, and service-health data.
What Makes a High-Performing Managed IT Service Provider?
A strong provider does more than process tickets. It maintains a current service view, detects deterioration early, restores affected services quickly, communicates clearly, and removes recurring causes. Its reports should allow an IT leader to answer five practical questions:
- Are critical services available when users need them?
- Are incidents being detected before users report them?
- Are fixes durable, or are the same faults returning?
- Are changes improving the environment without creating avoidable risk?
- Is the provider reducing operational exposure over time?
These questions prevent metric theatre. Ticket, alert, and patch volumes describe activity, not service quality. High-performing providers use managed IT provider metrics as a connected measurement system rather than a monthly collection of unrelated totals.
The same discipline applies to IT service KPIs. Each indicator needs a formula, data source, owner, reporting period, exclusion rule, and business interpretation. Otherwise, teams debate the number instead of improving the service.
SLA Metrics That Show Whether Commitments Are Real
An SLA is a contractual commitment with precise definitions, measurement conditions, and exclusions. Microsoft advises readers to examine how availability is calculated and what conditions sit outside the guarantee, rather than treating the headline percentage as the whole commitment.
That principle should shape SLA performance metrics. An attainment rate becomes meaningful only when the report also shows the denominator, paused time, excluded tickets, business hours, priority changes, reopened cases, and breaches by service.
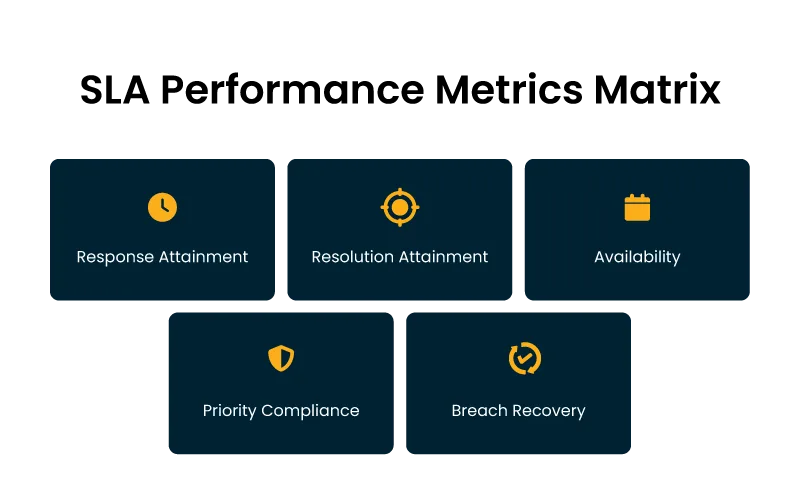
| Metric | What it should measure | What weak reporting often hides |
| Response attainment | Time from valid ticket creation to qualified human or automated acknowledgement | Auto-replies counted as meaningful response |
| Resolution attainment | Time until service is restored or the request is completed | Tickets closed before user confirmation |
| Availability | Successful service time during an agreed measurement window | Planned exclusions that remove too much downtime |
| Priority compliance | Performance by severity and business impact | Priority downgrades used to avoid a breach |
| Breach recovery | Time taken to recover after a target is missed | Breaches reported without corrective action |
A monthly average can also conceal severe variation. Suppose nine priority 1 incidents are restored in 20 minutes and one takes seven hours. The average appears tolerable, yet the outlier may have caused the largest business loss. Report the median, the 90th percentile, and the worst case alongside the average.
Good managed IT provider metrics also separate provider-controlled delays from customer-controlled waiting time. The distinction requires evidence. A paused clock should show who requested information, what was missing, and when work resumed.
Service Quality Indicators That Go Beyond Ticket Closure
Ticket closure is an administrative event. Service recovery is an operational outcome. That gap is where many reporting models fail.
Atlassian notes that teams must agree on the exact meaning of MTTR because it can refer to repair, recovery, resolution, or response. A provider should therefore define each time-based measure in plain language. IT service KPIs become unreliable when the clock starts or stops at different stages across tools, teams, or contracts.
1. Mean Time to Detect and User-Reported Incident Rate
Mean time to detect shows how quickly monitoring identifies a service issue. Pair it with the percentage of incidents first reported by users. A falling detection time means little if employees still discover most failures before the operations team.
This pair reveals monitoring coverage and triage discipline.
2. First-Contact Resolution and Reopen Rate
First-contact resolution is useful only when measured beside reopen rate and repeat contact. A fast answer that fails two hours later is poor support presented as efficiency.
High-performing providers segment first-contact resolution by request type. Password resets, access requests, endpoint faults, and application incidents have different diagnostic requirements. A blended percentage makes comparison easy and analysis weak.
3. Recurrence and Problem Removal
Track incidents linked to known problems, repeat faults per configuration item, and the percentage of root causes with completed corrective actions. These managed IT provider metrics show whether the provider is reducing demand or merely processing it.
A recurrence measure should use a defined service, fault signature, and time window. Loose definitions inflate improvement claims.
4. Change Success and Change-Caused Incidents
Change success should mean more than “implemented as planned.” A successful change should meet its objective without causing an incident, rollback, emergency correction, security exception, or unexpected user disruption.
Track failed changes, emergency changes, rollback frequency, incidents linked to recent changes, and time to stabilize. These IT service KPIs reveal whether delivery speed is creating hidden operational debt.
5. Communication Quality
Incident communication is measurable. Review update timeliness, accuracy, audience relevance, ownership clarity, and whether the final summary explains impact, cause, recovery, and prevention.
During a major incident, silence and vague updates increase disruption even when engineers are working effectively.
Performance Benchmarks That Support Better Decisions
Benchmarks are useful when they compare similar services under similar conditions. A global average for all tickets says little about a provider supporting a regulated, multi-site environment with round-the-clock operations.
Sound managed service benchmarks should account for service criticality, support window, user population, endpoint mix, application age, geographic coverage, automation level, and dependency complexity, which is why many enterprises compare co-managed IT vs fully managed IT models. The goal is a fair baseline that identifies movement, variance, and risk.
| Benchmark view | Decision it supports |
| Provider versus contractual target | Is the provider meeting the agreed minimum? |
| Current quarter versus prior quarters | Is performance improving or deteriorating? |
| Service versus service | Which applications or locations need attention? |
| Peer group with similar operating conditions | Is performance competitive and credible? |
| Top quartile within the customer environment | Which practices should be repeated elsewhere? |
Avoid copying external numbers directly into contracts. Google’s reliability guidance distinguishes an internal objective from the minimum promise in an SLA and recommends setting targets around what users actually need. The same logic applies to SLA performance metrics. A target should reflect business tolerance, service architecture, recovery options, and cost.
The strongest managed IT provider metrics use trends and distributions. Review the direction of service availability, breach frequency, recurrence, backlog age, change failure, security remediation, and customer effort across several periods. Sustained movement is stronger evidence than one good month.
Provider reviews should also test data integrity. Select a sample of incidents and trace each figure back to monitoring, ITSM, endpoint, change, and communication records. This prevents manual adjustment, duplicate exclusion, and priority manipulation from passing unnoticed.
How to Build an MSP Scorecard That Leaders Can Use
A useful scorecard should fit on one page, with drill-down evidence available behind it. Organize IT service KPIs into four views:
- Reliability: Availability, high-impact incidents, recurrence, and change-caused disruption.
- Responsiveness: Detection, acknowledgement, restoration, resolution, and communication speed.
- Control: Patch compliance, backup success, security remediation, asset accuracy, and change governance.
- Experience: Customer effort, reopen rate, satisfaction by service, and unresolved user friction.
Assign each measure a target, tolerance band, trend, owner, and required action. Red status should trigger a decision. If a measure can remain red for three months without an owner or recovery date, it is not governing the service.
Use managed service benchmarks to set context, then judge the provider on improvement within the customer’s environment. Mature service relationships reward prevention, transparent reporting, and disciplined correction. They do not reward low ticket volumes when users have stopped reporting problems because confidence has fallen.
What High-Performing MSP Metrics Should Reveal
The best provider dashboard is not the one with the most green indicators, and Enterprise AI solutions can help detect recurring incidents, service degradation patterns, and hidden support risks. It is the one that makes operational risk difficult to hide.
Well-designed managed IT provider metrics connect commitments, service behaviour, user impact, and corrective action. A mature scorecard also uses managed IT provider metrics to expose recurring risk. Well-defined IT service KPIs give both parties a shared language for performance. Reliable IT service KPIs also make ownership visible when performance slips. Together, they show whether the provider is maintaining services, learning from failure, and reducing avoidable demand.
That is the standard enterprise buyers should apply. Ask how each number is calculated, what it excludes, what decision it informs, and what action follows a miss. The quality of those answers will reveal more about a managed IT service provider than a polished monthly report ever will.
Author


Yogita Jain
Content Lead
Yogita Jain leads with storytelling and Insightful content that connects with the audiences. She’s the voice behind the brand’s digital presence, translating complex tech like cloud modernization and enterprise AI into narratives that spark interest and drive action. With a diverse of experience across IT and digital transformation, Yogita blends strategic thinking with editorial craft, shaping content that’s sharp, relevant, and grounded in real business outcomes. At Cygnet, she’s not just building content pipelines; she’s building conversations that matter to clients, partners, and decision-makers alike.