


Teams often struggle to make business decisions even when data is available. Reports exist across systems, dashboards are built, and metrics are tracked, yet clarity is missing. Sales, marketing, and finance rely on different numbers, which leads to delays and repeated discussions instead of action.
This challenge shows up when organizations try to implement data analytics. Data exists in large volumes, yet it remains scattered across tools and workflows. Teams spend more time validating numbers than using them. Insights remain underutilized, and decisions depend on interpretation rather than alignment.
A reliable analytics system requires consistency, accessibility, and clear ownership of data. Teams need shared definitions, connected systems, and workflows where insights directly influence actions. Without these elements, analytics remains limited to reporting.
This blog explains why most analytics implementations fail and how to avoid common pitfalls. You will learn a structured approach to connect data with decisions, improve adoption across teams, and build a system that consistently drives measurable outcomes.
Why Do Most Data Analytics Implementations Fail?
Most data analytics implementations fail for reasons that have very little to do with tools or technology. The real issue usually lies in how the system is planned, structured, and used within the business.
1. Starting With Tools Instead Of Business Problems
Many teams begin with platform selection or dashboard creation. The focus shifts to building infrastructure without defining which decisions need improvement, creating activity without direction.
Dashboards often track metrics that are easy to measure rather than metrics that influence outcomes. Teams review reports regularly, yet decisions remain unchanged.
This leads to
- Dashboards that do not guide decisions
- Metrics that are not tied to outcomes
- Continued reliance on intuition
2. Fragmented Data Across Systems
Data is distributed across CRM platforms, marketing tools, product analytics systems, and financial software. Each system captures a different part of the business.
Teams operate with partial visibility since data remains disconnected. Marketing focuses on campaigns, sales tracks the pipeline, and finance monitors revenue without a unified view.
Fragmentation also affects productivity. According to a 2022 report by IBM, poor data integration and accessibility contribute to significant inefficiencies across organizations.
Over time, this results in
- Inconsistent reporting across teams
- Conflicting metrics for the same performance indicators
- Slower and less confident decision-making
3. Poor Data Quality And Lack Of Trust
Data quality issues emerge when records are duplicated, values are missing, or definitions vary across teams. These inconsistencies reduce confidence in analytics outputs.
Gartner research shows that 44% of organizations cite poor data quality as a top barrier to analytics success, which highlights how directly it impacts confidence in insights and overall adoption.
Trust declines quickly once discrepancies appear. Teams begin cross-checking reports manually or maintaining separate datasets. This increases effort and reduces alignment.
4. Analytics Used Only For Reporting
Many organizations rely on analytics to describe past performance. Reports summarize activity, yet they do not influence decisions in a structured way.
Campaign adjustments, sales prioritization, and product changes often rely on judgment instead of consistent insights. Analytics becomes a reference point rather than a decision tool.
A stronger approach connects metrics with actions. Teams need clarity on what should change when performance shifts. Without this connection, reporting remains passive.
5. Lack Of Ownership Across Teams
Analytics involves multiple functions, including data engineering, analysis, and business operations. Ownership becomes unclear when responsibilities are not defined.
Metrics get interpreted differently across teams. Definitions change, and reporting cycles slow down. Accountability for data accuracy and outcomes remains unclear.
This creates
- Duplicate efforts across teams
- Misaligned KPIs
- Delays in execution
6. Insights Are Not Operationalized
Insights often remain confined to dashboards and discussions. Teams review performance regularly, yet workflows remain unchanged.
Planning, execution, and performance reviews continue without the structured use of insights. This disconnect limits the value of analytics.
A successful implementation ensures insights influence how teams operate daily. Decisions should reflect data consistently across functions.
Step-By-Step Data Analytics Implementation Framework
A structured approach improves consistency and adoption. Each step should connect data with decisions to ensure analytics supports real outcomes.
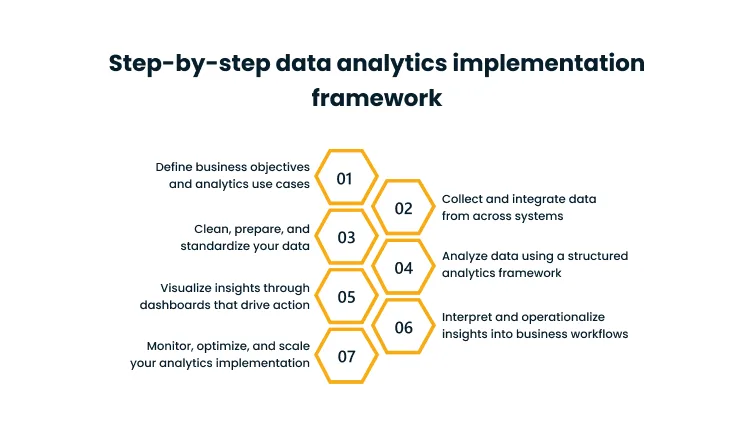
Step 1 – Define Business Objectives And Analytics Use Cases
Every effective analytics implementation starts with a clear understanding of what needs to improve in the business. Without this, teams fall into the trap of collecting and analyzing data without direction.
The key shift here is moving from a data-first mindset to a decision-first mindset. Instead of asking what data is available, the focus should be on identifying where decisions are currently slow, unclear, or inconsistent.
In many organizations, this becomes visible in recurring situations. Marketing teams struggle to decide where to allocate budget. Sales teams debate, which leads to prioritize. Product teams lack clarity on which features drive retention.
The most effective teams narrow their focus early. Rather than trying to cover every possible metric, they select a small number of high-impact use cases. This allows them to build depth and reliability before expanding.
For example, focusing on customer churn may require understanding user behavior, engagement patterns, and support interactions. By solving this one problem well, teams create a foundation that can later be extended to other areas.
Clarity at this stage also requires defining how success will be measured. If improving conversion is the goal, then conversion must be clearly defined, tracked consistently, and tied to specific actions.
A practical way to refine objectives is to examine how decisions are currently made. If teams rely on intuition or fragmented reports, those areas should be prioritized. Analytics should replace guesswork with structured insight.
Step 2 – Collect And Integrate Data From Across Systems
Most organizations operate with multiple systems that capture different aspects of the business.
Customer interactions might be tracked in a CRM, marketing performance in campaign platforms, product usage in analytics tools, and revenue in financial systems. Each system provides partial visibility, but none offers a complete picture on its own.
The challenge is not just collecting data from these systems but making sure it can be combined meaningfully. Integration without alignment often creates more confusion rather than clarity.
A common issue is inconsistent identifiers. A single customer may appear under different names, IDs, or formats across systems. Without resolving these differences, it becomes difficult to track behavior across the customer lifecycle.
Another issue is inconsistent structure. Campaign names, product categories, or time periods may not follow a standard format, making comparisons unreliable.
To implement data analytics effectively, integration should focus on creating a unified model of the business. This involves
- Establishing consistent identifiers for customers, products, and accounts
- Aligning naming conventions across systems
- Standardizing timeframes and reporting periods
- Ensuring that revenue and cost data follow consistent definitions
Modern cloud-based systems make it easier to connect data sources, but connectivity alone does not solve alignment issues. The real work lies in creating consistency so that data from different systems can be trusted and used together.
In practice, this level of integration often requires more than basic data connections. It involves building a unified data foundation that aligns systems, structures, and access across teams.
Approaches like Cygnet.One’s transformation framework focuses on connecting data sources end-to-end while improving accessibility, so teams can work with a complete and consistent view of the business.
Step 3 – Clean, Prepare, And Standardize Your Data
Data preparation is often underestimated, yet it is one of the most critical steps in the entire process. Without clean and standardized data, even the most advanced analytics tools will produce unreliable results.
Data quality issues tend to surface in predictable ways.
- Duplicate records create inflated counts.
- Missing values lead to incomplete analysis.
- Inconsistent naming makes aggregation difficult.
- Misaligned definitions create conflicting metrics.
These problems are not always obvious at first. They often appear when teams start comparing reports or when insights do not match expectations.
Trust in analytics depends on consistency. When teams repeatedly see accurate and consistent numbers, confidence grows. When discrepancies appear, trust erodes quickly.
This step requires both technical and organizational alignment. Cleaning data involves removing duplicates, correcting errors, and handling missing values. Standardization involves agreeing on how key metrics are defined and calculated.
Documentation plays an important role here. Teams need clarity on how metrics are derived, what data sources are used, and what assumptions are built into the analysis. Without documentation, knowledge remains fragmented and difficult to scale.
Organizations that invest time in this stage reduce rework later. Instead of constantly fixing issues after dashboards are built, they establish a reliable foundation from the start.
Step 4 – Analyze Data Using A Structured Analytics Framework
Many teams fall into the habit of running ad hoc queries based on immediate questions. While this can provide quick answers, it does not create a repeatable system for generating insights.
A structured analytics approach ensures that analysis is consistent, comparable over time, and aligned with business objectives.
Different methods are suited to different problems. Funnel analysis helps identify where users drop off in a process. Cohort analysis reveals how behavior changes over time. Segmentation uncovers patterns across different customer groups.
The value of these methods lies in their ability to move from observation to explanation. Instead of simply reporting that a metric changed, structured analysis helps explain why it changed and what might happen next.
A practical framework for analysis follows a progression
- Understanding what happened by examining trends and patterns
- Investigating why it happened by identifying contributing factors
- Anticipating what might happen next based on historical behavior
- Determining what actions should be taken in response
This progression transforms analytics from a descriptive tool into a decision-support system.
There is also an important shift happening in how organizations approach analysis. As artificial intelligence becomes more widely used, analytics is moving toward automation and prediction. This allows teams to move faster and focus more on interpreting insights rather than generating them.
However, advanced capabilities only deliver value when the foundational steps are solid. Predictive models and automated insights depend on clean, integrated, and well-structured data.
A strong analytics implementation builds this foundation first, then expands into more advanced use cases as the organization matures.
Step 5 – Visualize Insights Through Dashboards That Drive Action
Dashboards should simplify decisions. Users should understand performance and required actions without additional analysis.
Effective dashboards focus on a limited set of key metrics aligned with business goals. Supporting context, such as trends and comparisons, improves clarity.
Key characteristics of effective dashboards include
- Clear prioritization of key performance indicators tied to business outcomes
- Trend visibility to show how performance is changing over time
- Segmentation to identify where issues or opportunities exist
- Visual cues that highlight anomalies or deviations from expected performance
Each section of a dashboard should answer a specific business question. For example, a revenue dashboard should help answer whether growth targets are being met, which channels are driving results, and where performance is declining. A marketing dashboard should clarify which campaigns are generating quality leads and where conversion rates are dropping.
Overloading dashboards with data reduces usability. Focused design improves decision speed and alignment.
Step 6 – Interpret And Operationalize Insights Into Business Workflows
Many teams generate reports and dashboards, but fail to connect them to day-to-day operations. Insights are reviewed in isolation and do not influence how teams plan, execute, or adjust their work. This creates a disconnect between analytics and outcomes.
Operationalizing analytics means embedding insights into existing workflows so that decisions are consistently informed by data.
This is where many organizations struggle in practice. Bridging the gap between insights and execution often requires redesigning how teams access and act on data. Cygnet.One’s approach to insight-driven transformation focuses on embedding analytics into workflows, so insights consistently translate into decisions and measurable outcomes.
For example, marketing teams use campaign performance data to adjust targeting, messaging, and budget allocation on an ongoing basis. Sales teams prioritize leads based on conversion likelihood rather than relying solely on intuition.
Product teams analyze usage patterns to identify features that drive retention or cause drop-offs. Operations teams should monitor performance metrics to identify inefficiencies and respond quickly.
To operationalize analytics effectively, organizations need to establish clear structures
- Assign ownership for key metrics so accountability is defined
- Link each metric to a specific action or decision
- Integrate dashboards into regular business processes such as weekly reviews or planning cycles
- Ensure that insights trigger follow-up actions rather than remaining as observations
A common pain point is the lack of follow-through. Teams may identify an issue such as declining conversion rates, but without a defined process, no action is taken. Over time, this reduces confidence in analytics and limits its impact.
When analytics becomes part of how teams operate, it shifts from being a reporting function to a decision system. This is the point where implementation starts delivering real value.
Step 7 – Monitor, Optimize, And Scale Your Analytics Implementation
Analytics evolves with the business. New data sources, changing priorities, and growing complexity require continuous refinement.
Monitoring ensures data quality and consistency. Teams should track usage patterns and validate metrics regularly.
Optimization improves both technical and operational aspects. Data pipelines, dashboards, and workflows should adapt to new requirements.
Scaling requires infrastructure that supports increasing data volumes. Cloud-based systems enable flexibility and performance.
Organizations that treat analytics as an ongoing capability achieve better long-term outcomes.
How To Measure The Success Of Analytics Implementation
Success depends on outcomes rather than outputs. Metrics should reflect decision quality and business performance.
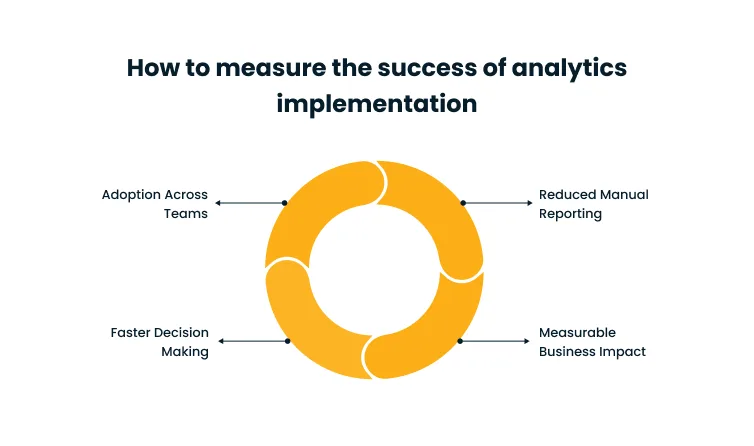
1. Adoption Across Teams
Adoption indicates whether analytics is integrated into workflows. Teams should use shared dashboards and rely on consistent metrics during discussions.
Low adoption signals gaps in trust, clarity, or usability. Addressing these issues improves engagement and alignment.
2. Faster Decision Making
Analytics should reduce the time it takes to move from question to action. When teams can access reliable data quickly, they spend less time gathering information and more time making decisions.
Delays in decision-making often indicate gaps in data accessibility, integration, or clarity. Improving these areas helps teams respond faster to changes in performance.
Approaches such as Cygnet.One’s insight-driven business transformation focuses on aligning data access, reporting, and execution so teams can act on insights without delays.
3. Reduced Manual Reporting
A strong analytics implementation minimizes repetitive tasks. Analysts should not spend most of their time exporting data, reconciling numbers, or building one-off reports.
Automation and standardized reporting processes allow analysts to focus on higher-value work such as interpreting trends and providing recommendations.
4. Measurable Business Impact
The ultimate measure of success is whether analytics improves business outcomes. This includes improvements in revenue growth, cost efficiency, customer retention, and operational performance.
This is where the difference between activity and impact becomes clear. McKinsey reports that companies using data-driven sales analytics can see EBITDA improvements in the range of 15 to 25%, showing how effective analytics directly translates into measurable financial outcomes when it is properly implemented and used.
If analytics does not influence outcomes, it is not fully integrated into the business. The goal is not to produce more data, but to enable better decisions that lead to measurable results.
Conclusion
Data creates value only when it consistently influences decisions across teams. Many organizations reach a point where data is available and dashboards are in place, yet execution does not improve at the same pace.
Start with one decision that directly impacts outcomes. Define the data behind it, assign ownership, and connect insights to a clear action. This creates a repeatable model that can scale without adding complexity.
Sustaining this requires connected systems, accessible data, and workflows where insights fit naturally into execution. Gaps in these areas slow adoption and limit impact.
This is where Cygnet.One helps organizations move from fragmented reporting to structured execution. Its insights-driven business transformation approach connects data across systems and embeds analytics into workflows so teams can act with clarity and speed.
The goal is consistent, data-driven decisions across the business. Book a demo with Cygnet.One today and build a data analytics implementation aligned with your business goals and workflows.
FAQs
Data analytics implementation involves building systems and workflows that convert raw data into insights used in business decisions. It includes collecting data from different sources, cleaning and structuring it, and making it accessible for analysis. The goal is to ensure teams can use data consistently to guide actions, not just review reports.
The timeline depends on data complexity, system readiness, and business scope. Smaller use cases with limited data sources can be implemented within a few weeks. Larger implementations that involve multiple systems, data integration, and process changes can take several months to stabilize and scale.
The process starts with defining business objectives and identifying key use cases. It then moves to integrating data, preparing and standardizing it, and applying structured analysis. Insights are visualized through dashboards, embedded into workflows, and continuously optimized based on feedback and evolving business needs.
Organizations typically use data integration tools to collect data, storage systems such as data warehouses, and transformation tools to prepare data. Business intelligence platforms help visualize insights through dashboards. The choice of tools depends on data volume, complexity, and how teams need to access and use insights.
Business intelligence focuses on reporting and tracking historical performance through dashboards. Data analytics goes further by identifying patterns, explaining trends, and supporting future decisions. Analytics helps teams understand why something happened and what actions should follow, rather than just showing what happened.
Failures often occur when there is poor data quality, unclear objectives, or disconnected systems. Many teams also struggle to align metrics across departments or embed insights into workflows. Without consistent usage and ownership, analytics remains limited to reporting and does not influence decisions.
Success is measured by how consistently teams use data in decision-making. High adoption across teams, faster decision cycles, and reduced manual reporting indicate progress. The strongest indicator is measurable business impact, such as improved performance, better efficiency, or more accurate forecasting.
Author


Abhishek Nandan
AVP, Marketing
Abhishek Nandan is the AVP of Services Marketing at Cygnet.One, where he drives global marketing strategy and execution. With nearly a decade of experience across growth hacking, digital, and performance marketing, he has built high-impact teams, delivered measurable pipeline growth, and strengthened partner ecosystems. Abhishek is known for his data-driven approach, deep expertise in marketing automation, and passion for mentoring the next generation of marketers.