


A few years ago, you could fix most production issues by logging into a server.
Now you open five dashboards, three tracing tools, two Slack threads, and still don’t know what’s actually broken.
That shift happened quietly.
AWS architectures have evolved rapidly with distributed systems and modern aws cloud services, but our monitoring mindset hasn’t changed as quickly.
We moved to microservices. Added Lambda. Split databases. Introduced queues. Integrated third party APIs. Deployed across regions. But many teams are still practicing the same kind of cloud monitoring they used when everything ran on a handful of machines, before adopting modern cloud engineering services for distributed environments.
And that’s the gap.
Traditional monitoring works when systems are predictable. Distributed systems are not. They are fluid. Dependencies talk to each other in ways that are hard to see. Failures are rarely loud. They are partial. Context matters more than raw metrics.
This is where AWS observability stops being a buzzword and starts becoming operational reality.
Because when something goes wrong in a distributed AWS architecture, the problem is usually not “Is the server healthy?”
It’s “Why did this specific request behave differently from the others?”
Traditional monitoring was never designed to answer that question.
Why Legacy Monitoring Fails
Traditional monitoring was built for predictable systems.
You had servers. You monitored CPU, memory, disk, and network. You set thresholds. If CPU crossed 85 percent, you triggered an alert. Simple.
But distributed AWS environments do not fail because CPU hits 85 percent.
They fail because:
- A downstream dependency responds 300 milliseconds slower.
- A message queue silently backs up.
- A Lambda function retries three times and then drops an event.
- A database connection pool gets exhausted for only certain tenants.
This is where the limitations of traditional monitoring become obvious.
Threshold-based monitoring answers one question well:
Is a resource healthy?
It struggles with a more important question:
Is the system behaving correctly for the user?
In distributed architectures, user experience is shaped by multiple services interacting in unpredictable ways. Monitoring individual components in isolation does not reveal how those components behave together.
And when failures are partial or conditional, traditional alerts do not trigger at all.
Distributed System Complexity on AWS
Modern AWS architectures are dynamic by design.
Auto scaling groups spin instances up and down. Containers are rescheduled. Serverless functions appear for milliseconds and disappear. Traffic patterns change by region. Feature flags alter request flows.
This is where distributed systems observability AWS discussions usually start. Because monitoring static hosts does not help when hosts are ephemeral.
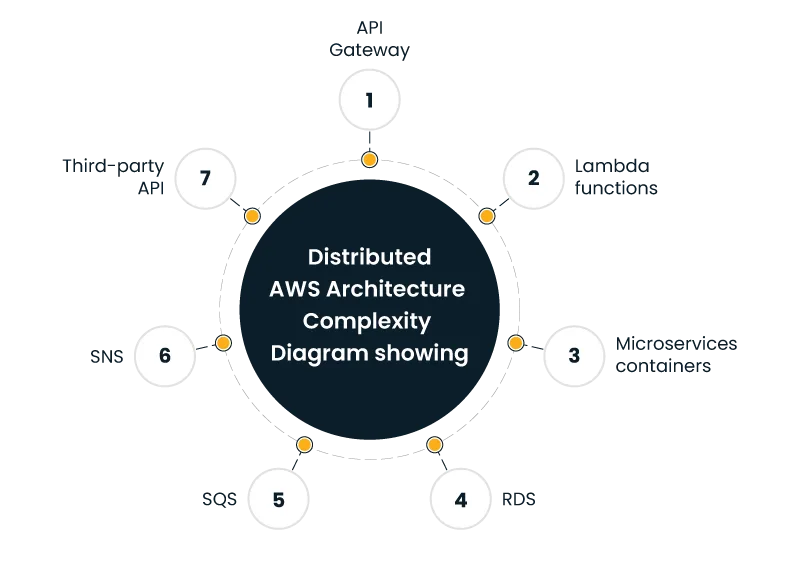
Consider a simple checkout workflow:
- API Gateway receives the request
- Lambda validates cart data
- Another Lambda calculates tax
- A third service checks inventory
- An RDS instance confirms order
- SNS sends confirmation
If step 3 adds 200 milliseconds only for certain ZIP codes, your infrastructure metrics look normal. CPU is fine. Memory is fine. Disk is fine.
But user latency increases.
Without tracing across services, you will never see that tax calculation service as the bottleneck—something often highlighted in distributed systems observability discussions. And your dashboard will still show green.
That is the operational reality of distributed systems.
Metrics vs Logs vs Traces
Most teams collect all three. Few connect them meaningfully.
Metrics give you numbers over time.
Logs give you events.
Traces show request journeys.
Traditional cloud monitoring focuses heavily on metrics. CPU usage, error rates, request counts. Useful, but incomplete.
Logs are often centralized but rarely correlated. During incidents, engineers grep through millions of lines hoping to find a pattern.
Traces, when implemented properly, change the conversation. They answer:
- Where did this request travel?
- How long did each hop take?
- Where did latency spike?
- Which dependency failed first?
This is where many teams compare CloudWatch vs observability tools and assume CloudWatch alone is enough.
CloudWatch provides metrics and logs. It also offers X-Ray for tracing. But stitching these together into a cohesive narrative requires deliberate design. It does not happen by default.
Observability is not about collecting more data. It is about connecting context.
And context is what reduces guesswork.
The Cost of Post-Migration Blind Spots
A pattern I see often: teams migrate to AWS using structured AWS migration and modernization strategies but keep the same monitoring mindset.
They move workloads to containers or serverless. They decommission old servers. They feel confident.
Then incidents begin.
These are classic post-migration monitoring challenges:
- Alerts tuned for on-prem hardware no longer apply.
- Ephemeral workloads generate noisy logs.
- Distributed tracing was never fully implemented.
- Cross-account visibility is fragmented.
- Third party SaaS dependencies are invisible.
After migration, complexity increases. Monitoring maturity often does not.
This is where AWS observability becomes more than a tooling discussion. It becomes an operational strategy.
If you do not rethink how you observe the system after migration, you inherit new failure modes without the visibility to manage them.
From Monitoring to Observability-Led Operations
Monitoring asks:
Did something cross a threshold?
Observability asks:
Why is this system behaving the way it is?
That shift changes how teams operate.
With strong AWS observability, teams can:
- Correlate a spike in latency with a specific deployment.
- Identify which microservice introduced errors.
- Detect cascading failures before customers notice.
- Understand performance at the tenant or feature level.
This matters because distributed systems rarely fail loudly.
They degrade.
A small latency increase in one service creates retries. Retries increase load. Load affects another service. Eventually, the system tips over.
Traditional cloud monitoring may detect the final failure. It does not show the early warning signs.
Observability surfaces patterns before outages become visible.
MTTR: Where Observability Pays Off
Mean Time to Resolution is not a vanity metric. It directly impacts revenue, customer trust, and engineering morale.
In traditional setups, incident response looks like this:
- Alert fires
- Engineers check dashboards
- They dig through logs
- They debate root cause
- They test hypotheses
- They finally identify the issue
This can take hours.
With strong AWS observability, the flow changes:
- Alert includes trace context
- Engineers see the affected service immediately
- Deployment metadata is attached
- Dependency graph highlights upstream impact
- Root cause is isolated faster
MTTR drops.
The real difference is cognitive load. Engineers do not have to mentally reconstruct the system from fragments of data.
Observability gives them a narrative, not just signals.
When teams discuss CloudWatch vs observability tools, the conversation should not be about features alone. It should focus on incident speed and clarity.
Because that is where business impact lives.
Why Are Thresholds Not Enough?
Here is an uncomfortable truth.
In distributed AWS environments, many failures do not breach static thresholds.
Latency may increase by 15 percent.
Error rates may rise from 0.2 to 0.5 percent.
Nothing crosses predefined limits.
Yet users notice.
This is another area where the limitations of traditional monitoring show up clearly. Static thresholds assume predictable patterns. Distributed architectures produce variable patterns.
Observability approaches rely more on:
- Baselines
- Behavioral patterns
- Correlation
- Anomaly detection
- Service level objectives
Instead of asking, “Did CPU exceed 80 percent?”
You ask, “Is this service behaving differently from its normal pattern?”
That question is far more powerful.
Real World Example: The Invisible Dependency
A fintech company runs a microservices platform on AWS. Everything looks stable. CPU low. Memory stable. No critical alerts.
Yet transaction times increase randomly.
After weeks of investigation, they discover a minor dependency. A fraud scoring API hosted by a third party. It occasionally slows by 400 milliseconds.
Traditional cloud monitoring never captured this because the infrastructure was fine. Only distributed tracing exposed the delay in external calls.
This is why distributed systems observability AWS practices matter. Dependencies are no longer internal. They extend beyond your VPC.
If you cannot observe those interactions, you are blind to part of your system.
Adoption Roadmap: Moving Toward AWS Observability
Shifting to AWS observability does not require replacing everything overnight. It requires intentional steps.
1. Map Critical User Journeys
Start with what matters to customers. Checkout. Login. Search. Track those flows end to end.
2. Implement Distributed Tracing First
Do not treat tracing as optional. Make it foundational. Without traces, root cause analysis remains guesswork.
3. Connect Logs to Context
Logs without trace IDs are noise. Ensure correlation IDs propagate across services.
4. Redesign Alerts Around Behavior
Move beyond static thresholds. Define service level objectives. Alert on deviations that impact users.
5. Review Tooling Strategy
When evaluating CloudWatch vs observability tools, assess:
- Cross-account visibility
- Distributed tracing depth
- Dependency mapping
- Deployment correlation
- Noise reduction capabilities
CloudWatch remains essential in AWS environments. But it may not be sufficient alone for complex architectures. The right decision depends on workload complexity and operational maturity.
6. Address Post-Migration Gaps
Revisit monitoring after every major architectural shift. Most post-migration monitoring challenges occur because visibility is not redesigned alongside infrastructure.
Migration changes failure modes. Observability must adapt accordingly.
The Strategic Angle
There is a bigger picture here.
Strong AWS observability is not just about uptime. It influences architecture decisions.
When teams can see how services behave under real load, they make better choices about:
- Service boundaries
- Retry logic
- Timeout settings
- Dependency isolation
- Capacity planning
Observability data informs design.
Traditional monitoring reports symptoms. Observability informs decisions.
That distinction matters.
Final Thought
If your dashboards are green but your customers are frustrated, you do not have a monitoring problem.
You have a visibility problem.
Distributed AWS architectures are not inherently unstable. They are just more complex. And complexity demands context.
Basic cloud monitoring tells you when a component is stressed.
Strong AWS observability tells you why the system behaves the way it does.
In 2026, the difference between the two often determines whether incidents last minutes or hours.
And when minutes turn into hours, customers remember.
So the real question is not whether you have monitoring in place.
It is whether you can explain, with confidence, what your system is doing right now and why.
If you cannot, it might be time to rethink how you observe your AWS environment.
Author


Yogita Jain
Content Lead
Yogita Jain leads with storytelling and Insightful content that connects with the audiences. She’s the voice behind the brand’s digital presence, translating complex tech like cloud modernization and enterprise AI into narratives that spark interest and drive action. With a diverse of experience across IT and digital transformation, Yogita blends strategic thinking with editorial craft, shaping content that’s sharp, relevant, and grounded in real business outcomes. At Cygnet, she’s not just building content pipelines; she’s building conversations that matter to clients, partners, and decision-makers alike.