




































A dashboard can be perfectly designed and still fail at the moment a manager has to decide what happens next.
The problem usually appears after access has been granted. Reports are available. Metrics have definitions. Teams have attended product demonstrations. Yet two managers can open the same dashboard, focus on different numbers, apply different thresholds, and leave with different conclusions. The organization technically has analytics. It does not yet have a consistent way to use analytics in business decisions — the adoption gap that purpose-built data analytics services address by connecting insight delivery to the decisions and workflows that drive business outcomes.
This is the practical gap that analytics enablement needs to close.
Gartner reported in 2025 that only 22% of surveyed organizations had defined, tracked, and communicated business-impact metrics for most of their data and analytics use cases — a finding that reflects the broader data analytics challenges modern teams face when trying to connect analytical work to measurable business impact. The finding points to a wider operating problem: deployment can be measured easily, while meaningful use is harder to see. Gartner also advises organizations to connect data literacy training to everyday business problems rather than relying on generic instruction.
Effective data literacy for business teams therefore has to move beyond teaching people where filters sit or how charts work. It needs to establish shared interpretation, expected decision behavior, and a clear way to ask for help when a metric does not make sense.
Why Analytics Access Does Not Produce Consistent Adoption
Analytics programs often treat availability as the finish line. Once a report is published and permissions are assigned, adoption is expected to follow.
Business users experience the situation differently. A sales manager may know how to open a pipeline dashboard but remain unsure which movement deserves intervention. A finance lead may understand a variance report yet use a different tolerance from another region. An operations manager may see a deteriorating service metric without knowing whether the number requires investigation, escalation, or no action.
These are usage problems rather than interface problems.
Data literacy for business teams becomes useful when it covers four practical abilities: reading a metric correctly, understanding its business context, deciding when the signal matters, and choosing the appropriate response. Training that stops at navigation leaves the hardest part untouched.
A strong analytics adoption playbook should therefore start with recurring decisions. The question is not simply, “Which dashboards should employees learn?” The better question is, “Which decisions should become more consistent because this information exists?”
That change in starting point affects the entire program.
Build Analytics Enablement Around Decisions, Not Features
The first design task is to identify recurring decisions for each business group. These could include approving a discount, changing a replenishment quantity, escalating an overdue receivable, or prioritizing a service issue.
For each decision, document the minimum decision context:
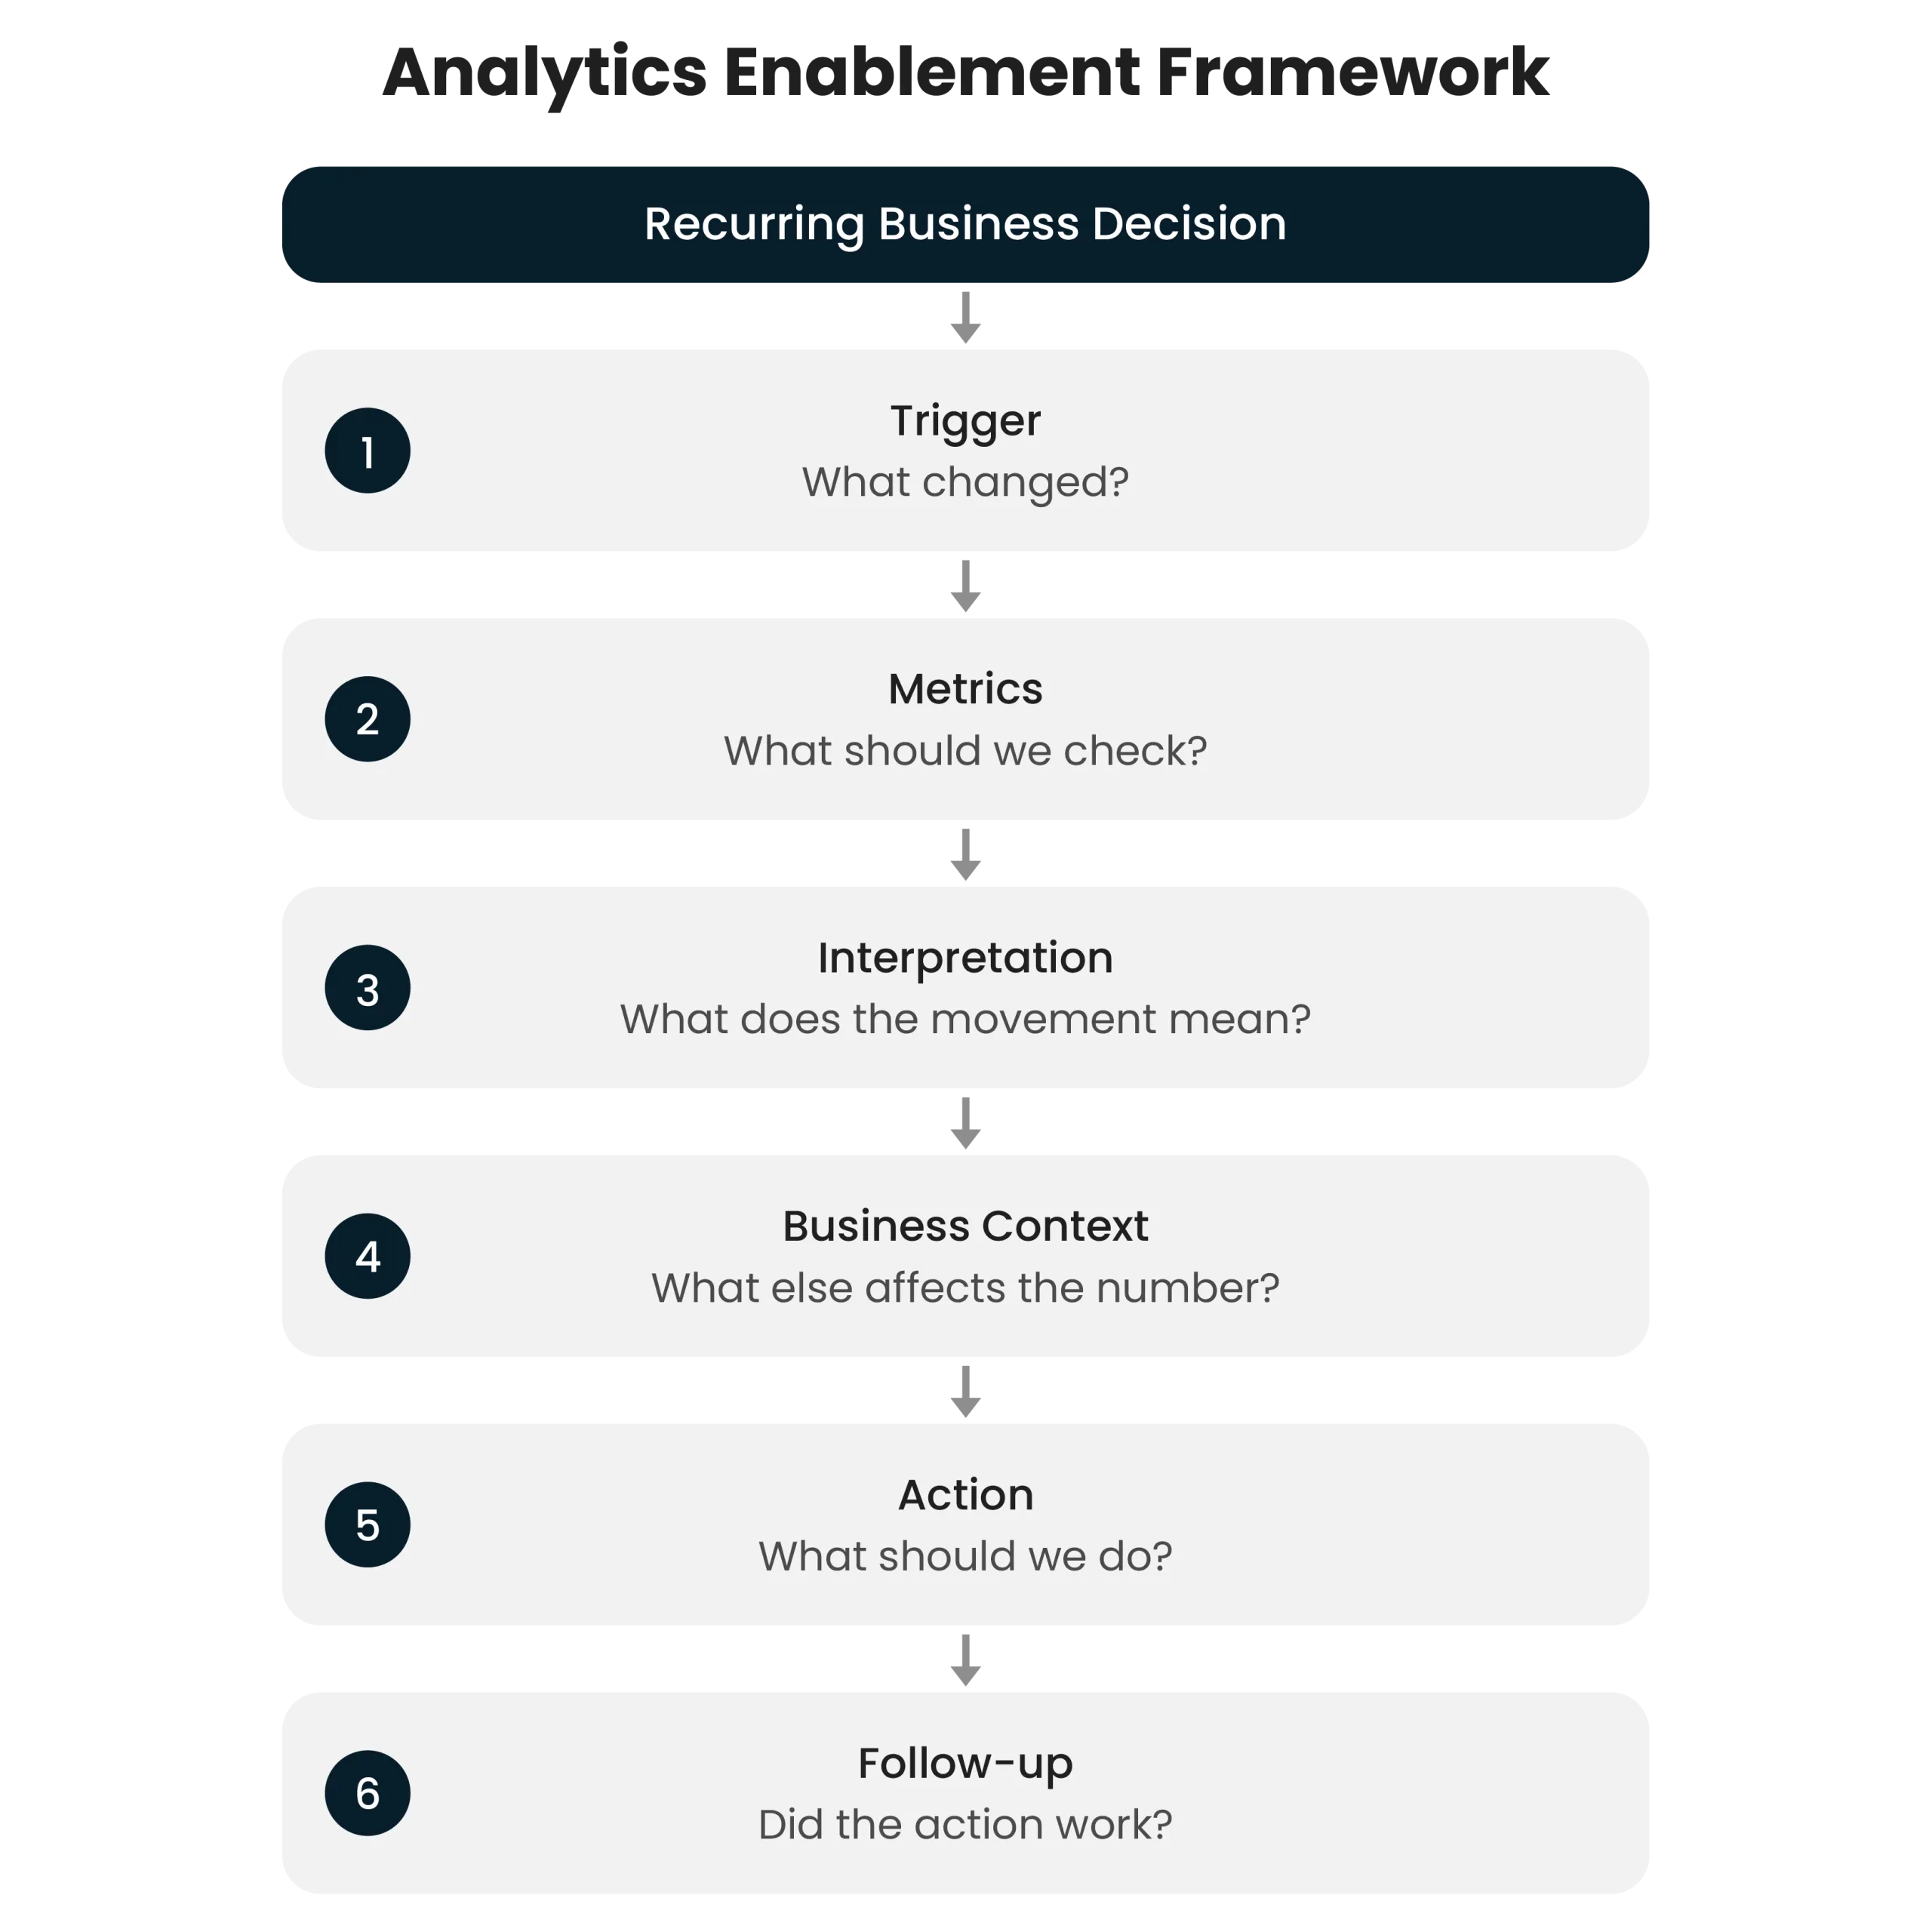
| Decision element | What the business team needs |
| Trigger | What event, threshold, or review point starts the decision |
| Required metrics | Which measures must be checked before action |
| Interpretation | What movement, exception, or pattern deserves attention |
| Business context | Which factors can change the meaning of the metric |
| Action options | Which responses are available to the decision owner |
| Escalation point | When the issue needs another role or function |
| Follow-up | How the result of the action will be reviewed |
This creates a bridge between reporting and operating behavior. It also prevents analytics enablement from becoming a collection of tool tutorials with no common business outcome.
The same decision guide can support onboarding, manager coaching, team reviews, and later measurement. It gives employees a reference when the real decision occurs.
Use Training to Teach Interpretation, Not Dashboard Navigation Alone
Dashboard usage training still has a place, especially when a report contains unfamiliar filters, drill paths, or definitions. It becomes far more useful when navigation is taught inside a business scenario.
Instead of demonstrating ten controls in sequence, training can begin with a decision: regional conversion has fallen for two reporting periods. Which views should be checked? Which comparison is valid? What additional context is required? At what point should action be taken?
This form of practice exposes misunderstandings quickly and keeps data literacy for business teams tied to real work.
A useful training sequence can combine:
- Short role-based sessions built around recurring decisions
- Realistic examples drawn from approved business scenarios
- Metric definition cards for commonly misunderstood measures
- Decision guides showing thresholds, exceptions, and escalation paths
- Brief practice exercises where participants explain the action they would take
The final exercise matters. Asking participants to state the next action reveals whether interpretation and operating judgment are aligned.
Give Business Data Champions a Clear Job
Business data champions often fail when the role is vague. Being “the data person” in a department can quickly turn into informal report support, access troubleshooting, and requests for new extracts.
A useful champion role needs boundaries.
Champions should help colleagues interpret approved metrics, reinforce agreed decision guides, surface recurring confusion, and bring unresolved questions back to the analytics team. They can also identify where a metric is technically correct but difficult to apply in a real operating context.
This gives central analytics teams evidence of where definitions or report designs create friction, while business teams gain a nearby source of context.
The role should not replace data owners, analysts, or governance responsibilities. These champions work best as local translators between defined analytics logic and day-to-day business use.
Selection also matters. The strongest candidate is often someone respected for business judgment. Credibility inside the workflow usually matters more than advanced tool skill.
Provide Ongoing Support for Analytics Decisions
Formal training cannot anticipate every question. Many adoption problems appear only when someone faces an unusual customer case or conflicting metrics across reports.
Analytics office hours provide a low-friction way to resolve those situations before teams create their own interpretations.
The format should stay practical. Employees bring a real question, the relevant report, and the decision they are trying to make. The session can then clarify the metric, identify missing context, or route a deeper issue to the correct owner.
Patterns from these sessions should be recorded. Repeated questions about conflicting metrics can expose documentation or report-design problems. Repeated uncertainty after a threshold breach can expose a gap in the decision guide.
This is where the format becomes more than support. It acts as an early-warning mechanism for inconsistent interpretation.
Create Templates for Decisions That Repeat
Templates reduce the amount of judgment required for routine analytical work. They also make expectations visible.
A weekly commercial review, for example, can use a standard structure:
- What changed since the previous review?
- Which movement is outside the accepted range?
- What business factor may explain it?
- What action is proposed?
- Who owns the action?
- When will the effect be checked?
The template makes the reasoning process consistent without dictating the answer.
This is where data-driven decision habits begin to form. Repetition matters because business teams rarely develop consistent analytical behavior from a single course. They develop it when the same questions appear in weekly reviews, operating meetings, planning cycles, and manager conversations.
Templates also reduce dependence on individual analytical confidence. A new manager can follow the same decision structure used by an experienced colleague.
Measure Usage at the Decision Level
Login counts and dashboard views can show activity. They cannot show whether analytics changed a decision — a measurement gap that a well-structured data strategy roadmap closes by tying analytical investment to business outcomes rather than usage statistics.
A mature analytics adoption playbook should measure several layers of use:
| Measurement layer | Example evidence |
| Reach | Active users, repeat users, team coverage |
| Understanding | Training checks, common interpretation errors |
| Application | Decisions supported by defined reports or metrics |
| Consistency | Use of agreed definitions, thresholds, and decision guides |
| Follow-through | Actions assigned and reviewed after analytical discussion |
| Outcome | Business measure linked to the recurring decision |
The goal is to establish whether the expected decision process is actually happening, without attributing every business result to analytics.
This makes analytics enablement measurable without reducing success to report traffic. A dashboard with fewer users may be highly valuable if those users make an important recurring decision. A heavily viewed dashboard may have little business impact if teams only consume it as information.
Usage measurement should therefore follow the decision, not the popularity of the artifact.
Reinforce Data-Driven Decision Habits Through Management Routines
Enablement weakens quickly when managers treat analytics as optional during reviews. Team behavior usually follows the questions leaders ask.
If a weekly meeting discusses performance without referring to agreed metrics, employees receive a clear signal about what matters — the cultural dimension of operational analytics vs strategic analytics that determines whether data literacy translates into consistent decision behavior or stays confined to training sessions. If a manager asks which source supports a conclusion, what changed, and what action follows, analytical discipline becomes part of normal work.
Manager routines are therefore part of analytics enablement.
Simple prompts can reinforce data literacy for business teams:
- Which metric triggered this discussion?
- Is the comparison based on the agreed definition?
- What context could change the interpretation?
- What action follows from the finding?
- When will the result be reviewed?
These prompts make analytical reasoning visible. They also help separate a useful insight from an interesting observation with no decision attached.
Over time, the routine can strengthen data-driven decision habits because interpretation is practiced inside actual work rather than confined to training sessions.
Treat the Playbook as an Operating System for Analytics Use
A good enablement program connects six pieces: role-based training, decision templates, champions, help channels, manager routines, and usage measurement. Each solves a different adoption problem.
Training builds baseline understanding. Templates reduce variation. Champions provide local context. Support channels resolve uncertainty. Managers reinforce expected behavior. Measurement shows whether the process is being used.
The pieces need to stay connected. Dashboard usage training without decision guidance can create confident navigation with inconsistent action. Champions without escalation routes can become unofficial support desks.
The operating model should include a review cycle. When metrics change, business rules shift, or teams repeatedly raise the same question, the relevant guide or training material should be updated. This keeps data literacy for business teams connected to current practice.
Make Consistent Decisions the Real Adoption Goal
Analytics adoption becomes meaningful when business teams interpret the same signal with enough consistency to make defensible decisions.
That requires more than access and occasional training. It requires an operating method that links metrics to business context, decisions, owners, actions, and follow-up. A well-designed program makes those connections visible and repeatable — the standard that business analytics and embedded AI services apply by placing governed insight at the point of decision rather than leaving it in a separate reporting layer..
The strongest analytics enablement programs therefore focus on behavior at the point of decision. They give teams practical guidance, local support, and a common reasoning structure. They also measure whether analytical input is being used where it matters.
When those elements work together, data literacy for business teams stops being a learning initiative that sits beside the business. It becomes part of how the business runs.
Author


Yogita Jain
Content Lead
Yogita Jain leads with storytelling and Insightful content that connects with the audiences. She’s the voice behind the brand’s digital presence, translating complex tech like cloud modernization and enterprise AI into narratives that spark interest and drive action. With a diverse of experience across IT and digital transformation, Yogita blends strategic thinking with editorial craft, shaping content that’s sharp, relevant, and grounded in real business outcomes. At Cygnet, she’s not just building content pipelines; she’s building conversations that matter to clients, partners, and decision-makers alike.