


Here’s the uncomfortable truth nobody tells you after a “successful” AWS migration: the real outage risk starts on Day 2, not Day 0.
You move workloads, validate the cutover, close the war room… and then the weird stuff begins. A checkout flow slows down only in one region. A batch job runs fine, but the monthly bill jumps. An API looks healthy, yet customers see errors. Teams blame code. Ops blames infrastructure. FinOps blames “more traffic.” And the business just sees lost trust.
This is exactly why AWS observability becomes critical after large-scale migrations, especially when enterprises move into continuous cloud operations and optimization. Not as a nice-to-have. As the only practical way to prove reliability, performance, and cost outcomes in a cloud-native environment.
In this blog, I’ll break down what goes wrong after migration and how it connects directly to post-migration cloud optimization strategies, why traditional cloud monitoring falls short, and how to build a usable AWS observability stack with distributed tracing at the center. We’ll also connect observability directly to migration optimization, because migrations are not “done” until they run well, cost well, and recover fast.
The post-migration blind spots nobody plans for
When teams migrate at pace, they focus on the big milestones:
- Cutover completed
- Applications responding
- Data synced
- Users back online
But cloud-native systems introduce blind spots that don’t show up during UAT or a short hypercare window.
Blind spot #1: “Green dashboards” with real user pain
You may see CPU normal. Memory normal. Error rate low.
Still, users complain: “It’s slow.”
Why? Because latency often hides in the edges:
- DNS + TLS overhead
- Misconfigured load balancer timeouts
- Retry storms between microservices
- Cold starts in serverless
- Noisy neighbors in shared resources
You can’t debug that with basic host metrics alone. You need AWS observability that connects user experience to backend cause—something traditional cloud infrastructure management alone cannot achieve.
Blind spot #2: Dependencies multiply after AWS moves
Even simple apps become dependency networks after migration:
- Services call other services
- APIs call queues
- Lambdas call databases
- Batch triggers event streams
And the failure patterns change. On-prem failures were often “one big thing.” Cloud failures are usually “a chain of small things.”
This is where distributed tracing stops being optional and becomes central to modern cloud-native architecture design. Traces show the request path and where time or errors stack up.
Blind spot #3: Cost behaves differently than expected
You don’t just pay for servers. You pay for choices:
- Data transfer paths
- Storage class mistakes
- Chatty service calls
- Over-provisioned compute
- Unbounded log volume
If you cannot connect cost spikes to a specific service behavior, your FinOps discussion becomes a debate. With AWS observability, it becomes a diagnosis.
Blind spot #4: Ownership gets unclear
After migration, teams often ask:
- “Who owns this alarm?”
- “Who approves this log retention?”
- “Who fixes this latency issue?”
The system is now shared across app, platform, security, and SRE. That’s why you need a single operational story across telemetry types.
Why does basic monitoring fail after large AWS migrations?
Most migration teams start with cloud monitoring because it feels familiar. CPU graphs. Memory graphs. Disk graphs. Some alarms. Done.
That approach breaks down in modern AWS environments because it answers the wrong questions.
Traditional monitoring answers “Is it up?”
But post-migration reality needs answers like:
- “Why is it slow only for a subset of users?”
- “Which service is causing retries?”
- “Where did the request spend time?”
- “Why did costs spike right after a release?”
- “Which dependency is failing first?”
That’s observability territory, not basic monitoring.
A simple way to understand AWS observability
Think of AWS observability like this:
You’re not watching machines.
You’re understanding behavior.
Observability means you can look at a problem you didn’t predict and still find the reason using telemetry.
And cloud-native telemetry has four pillars:
- Metrics (what changed)
- Logs (what happened)
- Distributed tracing (where it happened)
- Signals and context (why it happened in this release, this region, this user journey)
Most teams stop at metrics + logs. That’s why post-migration triage takes hours instead of minutes.
The observability stack that actually works on AWS
A strong AWS observability setup is not “install everything.”
It is a focused stack where each signal has a role.
1) Metrics: fast detection and guardrails
Metrics help you answer:
- “Is the service stable?”
- “Is latency trending up?”
- “Are errors rising?”
Core metric groups worth prioritizing post-migration:
Application
- Request rate (RPS)
- Error rate (4xx/5xx)
- P95 and P99 latency
Infrastructure
- CPU, memory, disk, network
- Node/pod health (if Kubernetes)
- Load balancer 4xx/5xx, target response time
Data layer
- DB connections, locks, slow queries
- Cache hit ratio
- Queue depth and age
Metrics are the smoke alarm. Not the fire investigation.
2) Logs: details, but only if structured
Logs help answer:
- “What error did we throw?”
- “Which input caused it?”
- “What did the service decide?”
After large migrations, log volume can explode. That’s why log discipline matters:
- Use JSON structured logs
- Add correlation IDs consistently
- Log intent, not noise
- Use sane retention tiers
Without structure, logs become expensive storage with low value. With structure, they become an investigation tool.
3) Distributed tracing: the missing link after migrations
If you migrated microservices or introduced managed services, tracing becomes your fastest root-cause tool.
Distributed tracing answers the question every incident starts with:
“Where is the time going?”
Example: A request takes 4.2 seconds.
Tracing can show:
- 150ms in API Gateway
- 2.8s waiting for a database call
- 900ms in a downstream service retrying
- 350ms in a third-party API
That’s a clean path to action.
This is why AWS observability stacks should treat tracing as a foundation, not an add-on.
4) Real user monitoring (RUM) and synthetic checks
Your backend can look healthy while users suffer.
Especially after DNS, CDN, or auth changes.
Add:
- Synthetic checks for key flows
- Browser-level timings for real users
- API probes from multiple regions
This closes the gap between “system health” and “customer experience.”
Diagram: What breaks after migration without observability?
Here’s a simple view of why teams struggle post-migration:
Customer issue reported
|
v
Basic cloud monitoring shows “OK”
|
v
Team checks logs (too many, no structure)
|
v
Guesswork + blame game
|
v
Hotfix shipped
|
v
Problem returns (root cause not found)
Now compare that to an AWS observability-driven path:
Customer issue reported
|
v
Trace shows latency spike in Service B
|
v
Logs confirm DB timeout on one query pattern
|
v
Metrics show connection pool saturation
|
v
Fix query + adjust pool + add alert
|
v
Cost + latency stabilize
Observability is not “more dashboards.”
It is faster truth.
What should be in an AWS observability stack in 2026?
In 2026, observability is less about tooling and more about usable signals. Teams want:
- One view across services
- Correlation between telemetry types
- Lower time-to-diagnosis
- Clear ownership
- Cost control of telemetry itself
A practical AWS-native stack usually includes:
AWS-native services (good defaults)
- CloudWatch metrics and logs
- CloudWatch alarms and dashboards
- AWS X-Ray (or OpenTelemetry-based tracing routed to a backend)
- CloudTrail for audit and API activity
- VPC Flow Logs for network visibility
But here’s the bigger point:
AWS observability is a design decision, not a tool decision.
If teams don’t standardize instrumentation, naming, and correlation IDs, even the best tools won’t help.
The performance + cost gains are real (and measurable)
Once your AWS observability setup is strong, performance work stops being guesswork. You get clean data and repeatable fixes.
Common performance wins after migration
1) Fixing retry storms
- Traces reveal retries between services
- Metrics show amplified request counts
- Logs reveal timeouts and backoff mistakes
2) Reducing chatty service calls
- Traces show high call counts per request
- You batch, cache, or redesign the call pattern
3) Cleaning up bad timeouts
- Post-migration load balancer and gateway defaults can be wrong
- Tracing + metrics show slow downstream and cascading failures
Common cost wins after migration
This is where migration optimization becomes visible.
1) Right-sizing
- Metrics show low utilization for long periods
- You adjust instance types, autoscaling boundaries, or serverless memory
2) Storage tuning
- Logs show large payload patterns
- You compress, move to cheaper tiers, or fix retention
3) Data transfer reduction
- Traces and network logs help identify cross-AZ or cross-region chatter
- You redesign placement and call flows
Here’s the key: cloud monitoring alone can show costs went up.
AWS observability helps explain why, service by service.
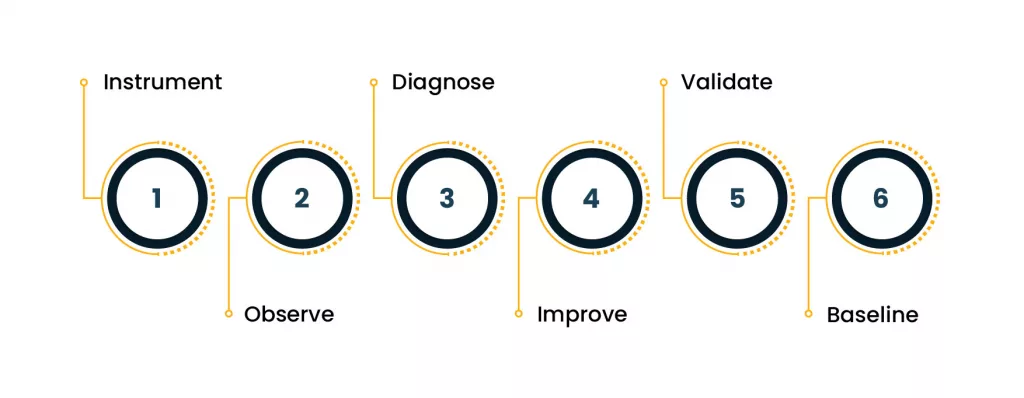
Diagram: Observability-led migration optimization loop
This is the loop that separates “migrated” from “running well”:
Instrument -> Observe -> Diagnose -> Improve -> Validate -> Repeat
More detail:
Telemetry added
|
v
Baseline created (latency, errors, cost)
|
v
Bottlenecks identified via tracing + metrics
|
v
Fix shipped (code/config/architecture)
|
v
Impact validated (before vs after)
|
v
New baseline stored
That is migration optimization in practice. No drama. No guessing.
Practical checklist: what to do in the first 30 days after migration
You don’t need perfection on day one. You need coverage that prevents painful surprises.
Week 1: Get the basics right
- Standardize service naming
- Define SLOs for critical services
- Establish error budgets for the top customer flows
- Set alerting for latency + error spikes
Week 2: Add traces where it matters
- Instrument the top 10 APIs
- Add trace propagation across services
- Track dependency latency per hop
- Store traces long enough to compare releases
This is where distributed tracing starts paying back immediately.
Week 3: Clean up logs to reduce noise and cost
- Convert high-volume logs to structured JSON
- Add correlation IDs in every service
- Reduce “debug spam” in production
- Set retention tiers based on value
Week 4: Tie observability to cost and performance outcomes
- Build dashboards that show cost + performance side by side
- Create release markers so you can link incidents to deployments
- Add weekly reviews focused on migration optimization, not just “incidents”
Common mistakes teams make with AWS observability
Here are the ones I keep seeing after large migrations:
Mistake 1: Too many dashboards, too little clarity
Dashboards should answer specific questions.
If they don’t, delete them.
Mistake 2: Alerts without ownership
If no one is responsible for an alert, it becomes noise.
Mistake 3: No correlation ID strategy
If you can’t follow a request end-to-end, triage becomes slow.
Mistake 4: Tracing only the “important” services
The slowest hop is often a dependency that teams think is minor.
Mistake 5: Treating observability as an ops-only concern
Post-migration success depends on shared visibility.
App teams need the same truth that platform teams see.
This is exactly why AWS observability is a team sport.
Where does cloud monitoring fit, and where it doesn’t?
Let’s be clear. Cloud monitoring is still necessary.
But it should be treated as the early warning layer, not the investigation layer.
Use cloud monitoring for:
- Availability checks
- Fast anomaly detection
- Capacity signals
- Guardrails
Use AWS observability for:
- Root cause analysis
- Cross-service latency breakdown
- Incident replay using traces
- Release impact tracking
- Cost behavior tied to service changes
And if you’re serious about cloud-native reliability, distributed tracing is the bridge between the two.
The real benefit: fewer incidents, shorter incidents, calmer teams
After large migrations, teams don’t just want uptime.
They want confidence.
A mature AWS observability setup does three things:
- Reduces incident frequency by catching patterns early
- Cuts incident time because traces reveal the failure chain
- Improves decision-making for performance and migration optimization
That’s what makes it critical. Not optional.
Final takeaway
A large AWS migration changes your architecture, your dependency patterns, and your cost model. That means your old visibility model stops working. Cloud monitoring alone won’t save you when issues hide inside service-to-service calls, managed integrations, and user experience edges.
If you want reliability that holds up under real production pressure, it must be backed by enterprise-grade AWS migration and modernization services, you need AWS observability built on metrics, structured logs, and distributed tracing.
And if your business case includes cost and performance improvement, observability is also the foundation for ongoing migration optimization.
Because the migration finish line isn’t cutover night.
It’s when you can explain every slowdown, every error spike, and every cost jump with proof.
Author


Yogita Jain
Content Lead
Yogita Jain leads with storytelling and Insightful content that connects with the audiences. She’s the voice behind the brand’s digital presence, translating complex tech like cloud modernization and enterprise AI into narratives that spark interest and drive action. With a diverse of experience across IT and digital transformation, Yogita blends strategic thinking with editorial craft, shaping content that’s sharp, relevant, and grounded in real business outcomes. At Cygnet, she’s not just building content pipelines; she’s building conversations that matter to clients, partners, and decision-makers alike.